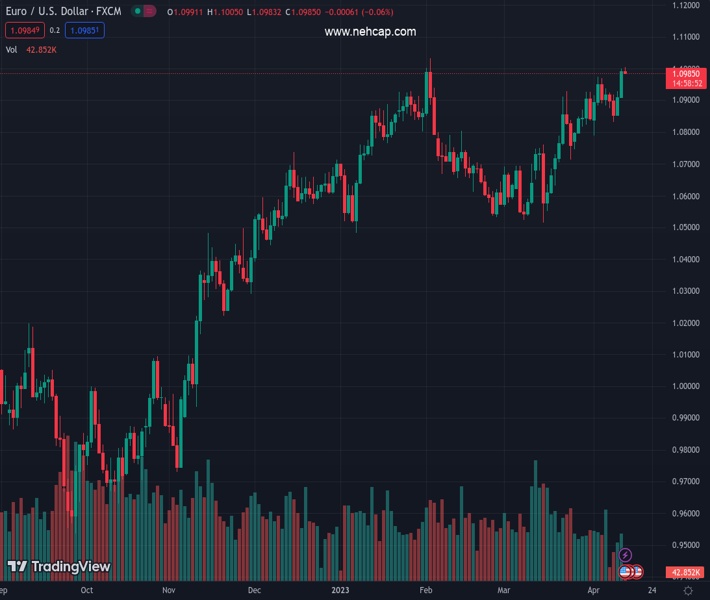
#EURUSD @ 1.09843 grinds near intraday low after refreshing 2.5-month high., @nehcap view: Limited downside expected (Pivot Orderbook analysis)
…
This is a premium post.
[s2If !current_user_can(access_s2member_level4)]Please register for PREMIUM VERSION HERE to read full post below containing analysis. In case of any error or you think you are not able to read the full post below, please email us at support#nehcap.com [lwa][/s2If] [s2If current_user_can(access_s2member_level4)]
- EUR/USD grinds near intraday low after refreshing 2.5-month high.
- Overbought RSI backs Euro pair’s pullback from three-week-old resistance line.
- Previous weekly top restricts immediate downside, 1.0860 is the key support.
The pair currently trades last at 1.09843.
The previous day high was 1.1 while the previous day low was 1.0911. The daily 38.2% Fib levels comes at 1.0966, expected to provide support. Similarly, the daily 61.8% fib level is at 1.0945, expected to provide support.
EUR/USD bulls take a breather around 1.0990 amid the initial hours of the European session on Thursday, after refreshing a 10-week top earlier in the day.
In doing so, the Euro pair takes a U-turn from an ascending resistance line from March 23 while justifying the overbought RSI conditions. However, bullish MACD signals and multiple levels towards the south keep the quote buyers hopeful.
That said, the previous weekly top surrounding 1.0970 appears immediate support for the EUR/USD bears to watch during further downside.
However, the weekly support line and the 200-Hour Moving Average (HMA), respectively near 1.0950 and 1.0910, could challenge the EUR/USD sellers afterward.
In a case where the EUR/USD bears dominate past 1.0910, the 1.0900 round figure and an upward-sloping support line from March 24, close to 1.0860 by the press time, will be the last defense of the pair buyers.
On the flip side, recovery moves need to cross the aforementioned three-week-long resistance line, near 1.1010 at the latest, to recall the EUR/USD bulls.
Even so, the yearly high marked in February around 1.1035 could challenge the Euro pair’s further upside before directing the buyers towards the late March 2022 peak of around 1.1185.
Overall, EUR/USD remains on the bull’s radar despite the latest retreat.
Trend: Limited downside expected
Technical Levels: Supports and Resistances
EURUSD currently trading at 1.0988 at the time of writing. Pair opened at 1.0992 and is trading with a change of -0.04 % .
| Overview | Overview.1 | |
|---|---|---|
| 0 | Today last price | 1.0988 |
| 1 | Today Daily Change | -0.0004 |
| 2 | Today Daily Change % | -0.0400 |
| 3 | Today daily open | 1.0992 |
The pair remains strongly bullish on the daily timeframe. It trades above its 20 SMA @ 1.0839, 50 SMA 1.0736, 100 SMA @ 1.0698 and 200 SMA @ 1.0362.
| Trends | Trends.1 | |
|---|---|---|
| 0 | Daily SMA20 | 1.0839 |
| 1 | Daily SMA50 | 1.0736 |
| 2 | Daily SMA100 | 1.0698 |
| 3 | Daily SMA200 | 1.0362 |
The previous day high was 1.1 while the previous day low was 1.0911. The daily 38.2% Fib levels comes at 1.0966, expected to provide support. Similarly, the daily 61.8% fib level is at 1.0945, expected to provide support.
Note the levels of interest below:
- Pivot support is noted at 1.0935, 1.0878, 1.0845
- Pivot resistance is noted at 1.1025, 1.1057, 1.1114
| Levels | Levels.1 |
|---|---|
| Previous Daily High | 1.1000 |
| Previous Daily Low | 1.0911 |
| Previous Weekly High | 1.0973 |
| Previous Weekly Low | 1.0788 |
| Previous Monthly High | 1.0930 |
| Previous Monthly Low | 1.0516 |
| Daily Fibonacci 38.2% | 1.0966 |
| Daily Fibonacci 61.8% | 1.0945 |
| Daily Pivot Point S1 | 1.0935 |
| Daily Pivot Point S2 | 1.0878 |
| Daily Pivot Point S3 | 1.0845 |
| Daily Pivot Point R1 | 1.1025 |
| Daily Pivot Point R2 | 1.1057 |
| Daily Pivot Point R3 | 1.1114 |
[/s2If]
Join Our Telegram Group
")


