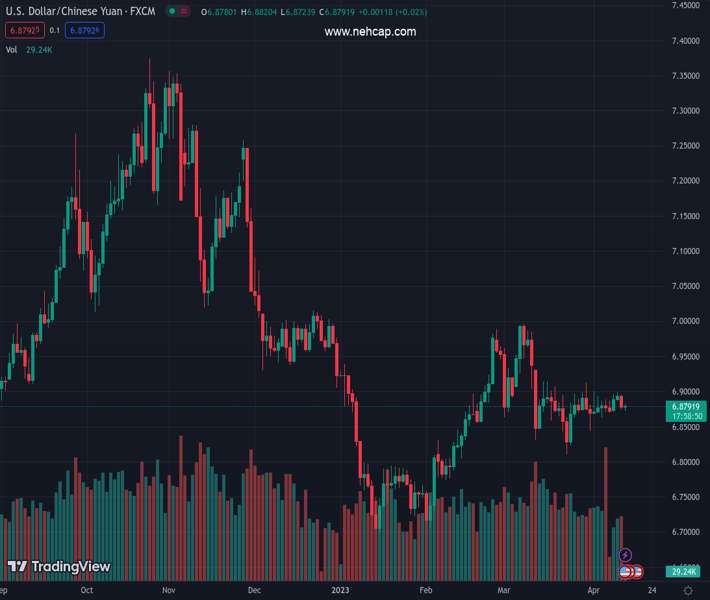
#USDCNH @ 6.87913 holds onto the previous day’s bearish bias after China trade numbers. (Pivot Orderbook analysis)
…
This is a premium post.
[s2If !current_user_can(access_s2member_level4)]Please register for PREMIUM VERSION HERE to read full post below containing analysis. In case of any error or you think you are not able to read the full post below, please email us at support#nehcap.com [lwa][/s2If] [s2If current_user_can(access_s2member_level4)]
- USD/CNH holds onto the previous day’s bearish bias after China trade numbers.
- China’s January–March Exports grew 8.4% YoY, Imports increased 0.2% YoY in Yuan terms.
- Broad-based US Dollar weakness, optimism from China exerts downside pressure on USD/CNH prices.
The pair currently trades last at 6.87913.
The previous day high was 6.8954 while the previous day low was 6.8748. The daily 38.2% Fib levels comes at 6.8827, expected to provide resistance. Similarly, the daily 61.8% fib level is at 6.8876, expected to provide resistance.
USD/CNH clings to mild losses around 6.8790 during early Thursday, extending the previous day’s downside momentum amid broad US Dollar selling and upbeat trade numbers from China, not to forget optimism surrounding the dragon nation.
It’s worth noting that China’s January–March Exports grew 8.4% YoY while Imports increased 0.2% YoY in Yuan terms. “In the first quarter, China’s trade remained resilient,” said China’s Customs Department after the trade data release.
Apart from the China data, the downbeat US Dollar Index (DXY) also weighs on the USD/CNF price. That said, the US Dollar Index (DXY) struggles for clear directions around 101.50 after falling the most in three weeks the previous day. That said, downbeat US inflation data and an absence of impressive Fed Minutes could be cited as the key catalysts for the DXY’s latest fall.
US Consumer Price Index (CPI) dropped to the lowest level since May 2021, to 5.0% YoY in March from 6.0% prior and versus 5.2% market forecasts. However, the annual Core CPI, namely the CPI ex Food & Energy, improved to 5.6% YoY during the said month while matching forecasts and surpassing 5.5% prior.
On the other hand, the Minutes of the latest Federal Open Market Committee (FOMC) Monetary Policy Meeting also challenged the Fed hawks by stating that the expectations for rate hikes were scaled back due to the turmoil in the banking sector. “Several Federal Reserve policymakers last month considered pausing interest rate increases after the failure of two regional banks and a forecast from Fed staff that banking sector stress would tip the economy into recession,” mentioned Reuters.
It should be noted that the International Monetary Fund (IMF) held China’s economic forecasts for 2023 and 2024 intact but expects the dragon nation to join India to be the global economic growth engine.
Elsewhere, the odds of the People’s Bank of China’s (PBoC) sustained easy money policy is higher than the dovish Fed concerns and hence keep the USD/CNH prices directed towards the south.
Against this backdrop, S&P 500 Futures print mild gain while snapping a three-day downtrend while the US Treasury bond yields remain indecisive at the latest. That said, the US 10-year Treasury bond yields snapped a three-day uptrend with mild losses to around 3.40% while the two-year counterpart also eased to 3.96% by marking the first daily negative in five.
Moving on, risk catalysts and more clues of the US inflation will be eyed for clear directions. However, major attention should be given to the Fed talks and geopolitical/growth headlines.
A 10-week-old ascending support line near 6.8745 restricts short-term USD/CNH downside.
Technical Levels: Supports and Resistances
USDCNH currently trading at 6.877 at the time of writing. Pair opened at 6.8806 and is trading with a change of -0.05% % .
| Overview | Overview.1 | |
|---|---|---|
| 0 | Today last price | 6.877 |
| 1 | Today Daily Change | -0.0036 |
| 2 | Today Daily Change % | -0.05% |
| 3 | Today daily open | 6.8806 |
The pair remains strongly bearish on the daily time frame. It trades below the 20 SMA @ 6.8778, 50 SMA 6.8798, 100 SMA @ 6.8955 and 200 SMA @ 6.9438.
| Trends | Trends.1 | |
|---|---|---|
| 0 | Daily SMA20 | 6.8778 |
| 1 | Daily SMA50 | 6.8798 |
| 2 | Daily SMA100 | 6.8955 |
| 3 | Daily SMA200 | 6.9438 |
The previous day high was 6.8954 while the previous day low was 6.8748. The daily 38.2% Fib levels comes at 6.8827, expected to provide resistance. Similarly, the daily 61.8% fib level is at 6.8876, expected to provide resistance.
Note the levels of interest below:
- Pivot support is noted at 6.8718, 6.863, 6.8512
- Pivot resistance is noted at 6.8924, 6.9042, 6.913
| Levels | Levels.1 |
|---|---|
| Previous Daily High | 6.8954 |
| Previous Daily Low | 6.8748 |
| Previous Weekly High | 6.9006 |
| Previous Weekly Low | 6.8630 |
| Previous Monthly High | 6.9970 |
| Previous Monthly Low | 6.8104 |
| Daily Fibonacci 38.2% | 6.8827 |
| Daily Fibonacci 61.8% | 6.8876 |
| Daily Pivot Point S1 | 6.8718 |
| Daily Pivot Point S2 | 6.8630 |
| Daily Pivot Point S3 | 6.8512 |
| Daily Pivot Point R1 | 6.8924 |
| Daily Pivot Point R2 | 6.9042 |
| Daily Pivot Point R3 | 6.9130 |
[/s2If]
Join Our Telegram Group
")


