The oil price managed to come out of the woods amid softening of US inflation. (Pivot Orderbook analysis)
…
This is a premium post.
[s2If !current_user_can(access_s2member_level4)]Please register for PREMIUM VERSION HERE to read full post below containing analysis. In case of any error or you think you are not able to read the full post below, please email us at support#nehcap.com [lwa][/s2If] [s2If current_user_can(access_s2member_level4)]
- The oil price managed to come out of the woods amid softening of US inflation.
- US inflation softening has weighed heavily on the US Dollar.
- Oil inventories reported a mild build-up of investors last week.
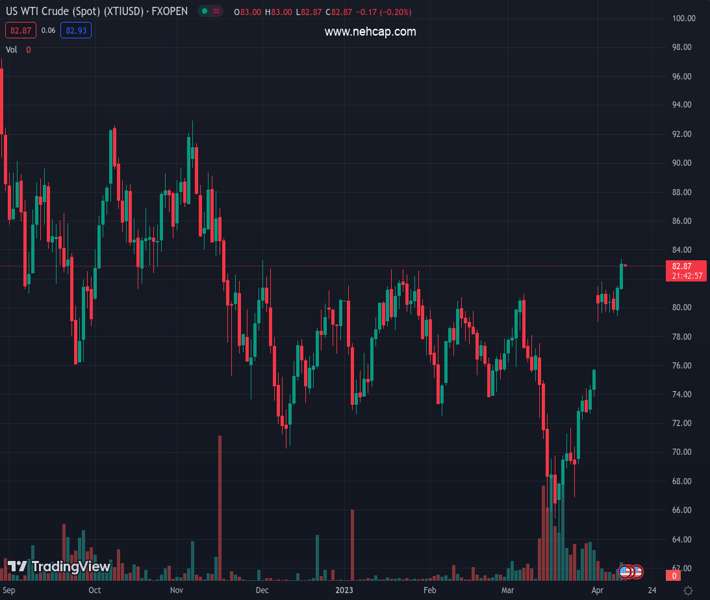
The pair currently trades last at 82.91.
The previous day high was 81.55 while the previous day low was 79.4. The daily 38.2% Fib levels comes at 80.73, expected to provide support. Similarly, the daily 61.8% fib level is at 80.22, expected to provide support.
West Texas Intermediate (WTI), futures on NYMEX, have turned sideways after printing a fresh four-month high at $83.48 on Wednesday. The oil price received immense buying interest from the market participants after the United States inflation data matched expectations.
Headline US Consumer Price Index (CPI) has decelerated to 5.0% while core inflation that excludes oil and food prices rebounded to 5.6%, which has kept chances of consecutive 25 basis points (bps) rate hike from the Federal Reserve (Fed) at elevated levels.
The US Dollar Index (DXY) has dropped to near its two-week low around 101.42 and is expected to deliver more losses ahead.
Meanwhile, US Energy Information Administration (EIA) has reported a mild build-up of oil inventories for the week ending April 07 by 0.597 million barrels while the street was anticipating a drawdown.
On an hourly scale, the oil price has delivered a breakout of the Darvas Box chart pattern, which results in wider ticks and heavy volume after a sheer volatility contraction. The aforementioned chart pattern placed in a range of $79.00-81.80.
Advancing 20-period Exponential Moving Average (EMA) at $82.44 indicates that the upside trend is extremely solid.
Adding to that, the Relative Strength Index (RSI) (14) is oscillating in the bullish range of 60.00-80.00, which confirms the activation of bullish momentum.
For a fresh buy, a mean reversion move to near the 20-EMA around $82.44 would offer a decent risk-reward. This would trigger responsive buying and will drive the asset towards November 16 high at $87.47 followed by the round-level resistance at $90.00.
On the flip side, a downside move below April 03 low would force oil to fill the gap inspired by the surprise announcement of production cuts by OPEC+. This will drag the asset towards March 31 high at $75.78 and March 28 low at $72.26.
Technical Levels: Supports and Resistances
XTIUSD currently trading at 82.91 at the time of writing. Pair opened at 81.41 and is trading with a change of 1.84 % .
| Overview | Overview.1 | |
|---|---|---|
| 0 | Today last price | 82.91 |
| 1 | Today Daily Change | 1.50 |
| 2 | Today Daily Change % | 1.84 |
| 3 | Today daily open | 81.41 |
The pair remains strongly bullish on the daily timeframe. It trades above its 20 SMA @ 73.72, 50 SMA 75.82, 100 SMA @ 76.81 and 200 SMA @ 82.82.
| Trends | Trends.1 | |
|---|---|---|
| 0 | Daily SMA20 | 73.72 |
| 1 | Daily SMA50 | 75.82 |
| 2 | Daily SMA100 | 76.81 |
| 3 | Daily SMA200 | 82.82 |
The previous day high was 81.55 while the previous day low was 79.4. The daily 38.2% Fib levels comes at 80.73, expected to provide support. Similarly, the daily 61.8% fib level is at 80.22, expected to provide support.
Note the levels of interest below:
- Pivot support is noted at 80.02, 78.64, 77.88
- Pivot resistance is noted at 82.17, 82.93, 84.32
| Levels | Levels.1 |
|---|---|
| Previous Daily High | 81.55 |
| Previous Daily Low | 79.40 |
| Previous Weekly High | 81.81 |
| Previous Weekly Low | 75.76 |
| Previous Monthly High | 80.99 |
| Previous Monthly Low | 64.39 |
| Daily Fibonacci 38.2% | 80.73 |
| Daily Fibonacci 61.8% | 80.22 |
| Daily Pivot Point S1 | 80.02 |
| Daily Pivot Point S2 | 78.64 |
| Daily Pivot Point S3 | 77.88 |
| Daily Pivot Point R1 | 82.17 |
| Daily Pivot Point R2 | 82.93 |
| Daily Pivot Point R3 | 84.32 |
[/s2If]
Join Our Telegram Group
")


