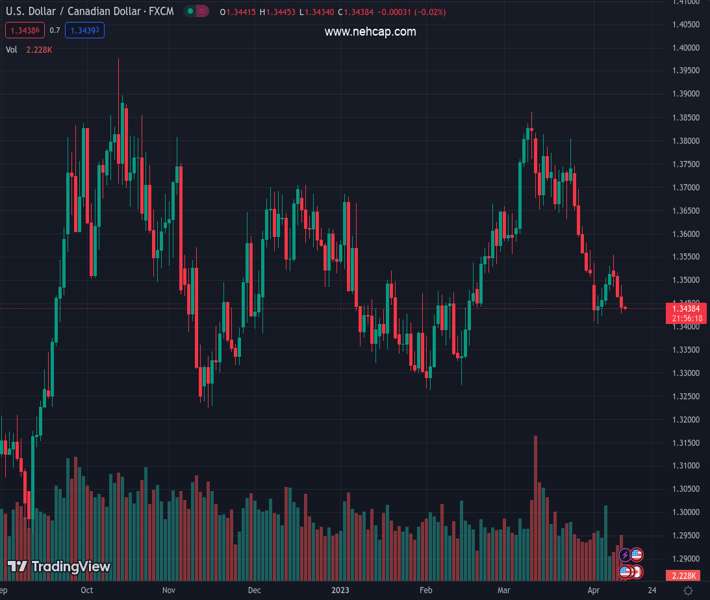
#USDCAD @ 1.34395 is struggling to keep its auction around 1.3440 as USD Index is eyeing more losses. (Pivot Orderbook analysis)
…
This is a premium post.
[s2If !current_user_can(access_s2member_level4)]Please register for PREMIUM VERSION HERE to read full post below containing analysis. In case of any error or you think you are not able to read the full post below, please email us at support#nehcap.com [lwa][/s2If] [s2If current_user_can(access_s2member_level4)]
- USD/CAD is struggling to keep its auction around 1.3440 as USD Index is eyeing more losses.
- Fed Daly believes that the central bank is at a point where a rate hike in each meeting is not necessary.
- The Canadian Dollar has registered a three-day losing streak despite the BoC Governor keeping interest rates steady at 4.5%.
The pair currently trades last at 1.34395.
The previous day high was 1.3516 while the previous day low was 1.3462. The daily 38.2% Fib levels comes at 1.3483, expected to provide resistance. Similarly, the daily 61.8% fib level is at 1.3496, expected to provide resistance.
The USD/CAD pair is struggling to sustain its auction around 1.3440 in the early Tokyo session. Downside bets for the Loonie asset are escalating as softened US Inflation and dovish Federal Reserve (Fed) policymakers are weighing heavily on the US Dollar. Also, higher oil prices amid weakness in the US Dollar are supporting the Canadian Dollar.
The USD Index is declining toward its two-month low of 100.82 as the United States Consumer Price Index (CPI) has softened beyond expectations to 5.0% due to weaker gasoline prices. However, core inflation rebounded to 5.6% but remains akin to consensus due to persistent rent prices.
The release of the Fed minutes for the March monetary policy meeting conveys that a 50 basis point (bp) rate hike move was in consideration but didn’t get life due to banking turmoil. Also, Fed policymakers are expecting a mild recession at the end of the year. Fears of mild recession joined anxiety over US quarterly earnings and weighed on S&P500. Meanwhile, the 500-US stocks basket futures have generated more losses in early Asia, portraying an asset-specific action.
San Francisco Fed Bank President Mary Daly believes that the Fed is at a point where a rate hike in each meeting is not necessary. However, she refrained from forecasting the end of a tightening cycle.
The Canadian Dollar has registered a three-day losing streak despite Bank of Canada (BoC) Governor Tiff Macklem keeping interest rates steady at 4.5%. BoC’s Governing Council considered the likelihood that rates may need to remain restrictive for longer to return inflation to the 2% target, however, the tight labor market could force the central bank to reconsider its neutral policy stance.
On the oil front, oil prices have shifted their business above the critical resistance of $83.00 amid weakness in the US Dollar and softening inflation expectations. The oil price ignored a mild build-up of inventories by 0.597 million barrels against the expectations of a drawdown for the week ending April 07, as reported by US Energy Information Administration (EIA). It is worth noting that Canada is the leading exporter of oil to the US and higher oil prices would strengthen the Canadian Dollar.
Technical Levels: Supports and Resistances
USDCAD currently trading at 1.3442 at the time of writing. Pair opened at 1.3466 and is trading with a change of -0.18 % .
| Overview | Overview.1 | |
|---|---|---|
| 0 | Today last price | 1.3442 |
| 1 | Today Daily Change | -0.0024 |
| 2 | Today Daily Change % | -0.1800 |
| 3 | Today daily open | 1.3466 |
The pair is trading below its 20 Daily moving average @ 1.3599, below its 50 Daily moving average @ 1.356 , below its 100 Daily moving average @ 1.353 and above its 200 Daily moving average @ 1.3395
| Trends | Trends.1 | |
|---|---|---|
| 0 | Daily SMA20 | 1.3599 |
| 1 | Daily SMA50 | 1.3560 |
| 2 | Daily SMA100 | 1.3530 |
| 3 | Daily SMA200 | 1.3395 |
The previous day high was 1.3516 while the previous day low was 1.3462. The daily 38.2% Fib levels comes at 1.3483, expected to provide resistance. Similarly, the daily 61.8% fib level is at 1.3496, expected to provide resistance.
Note the levels of interest below:
- Pivot support is noted at 1.3447, 1.3427, 1.3393
- Pivot resistance is noted at 1.3501, 1.3536, 1.3555
| Levels | Levels.1 |
|---|---|
| Previous Daily High | 1.3516 |
| Previous Daily Low | 1.3462 |
| Previous Weekly High | 1.3537 |
| Previous Weekly Low | 1.3406 |
| Previous Monthly High | 1.3862 |
| Previous Monthly Low | 1.3508 |
| Daily Fibonacci 38.2% | 1.3483 |
| Daily Fibonacci 61.8% | 1.3496 |
| Daily Pivot Point S1 | 1.3447 |
| Daily Pivot Point S2 | 1.3427 |
| Daily Pivot Point S3 | 1.3393 |
| Daily Pivot Point R1 | 1.3501 |
| Daily Pivot Point R2 | 1.3536 |
| Daily Pivot Point R3 | 1.3555 |
[/s2If]
Join Our Telegram Group
")


