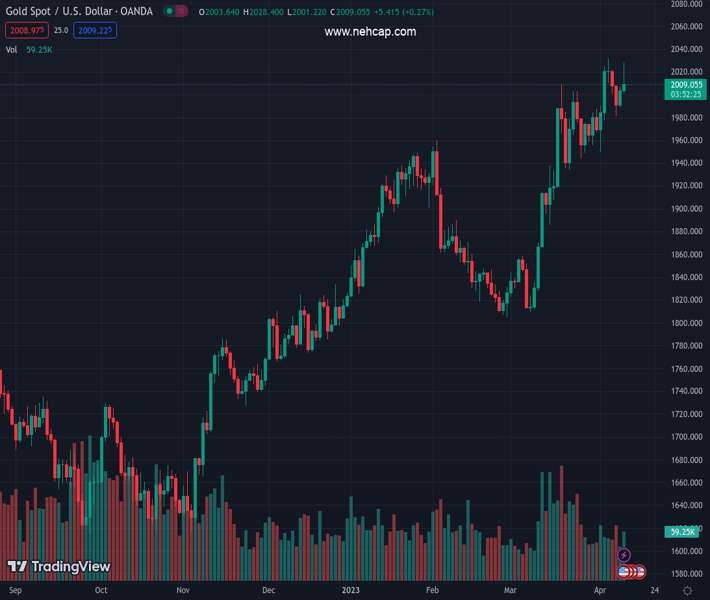
#XAUUSD @ 2,007.69 Gold price extended its gains on mixed US economic data. (Pivot Orderbook analysis)
…
This is a premium post.
[s2If !current_user_can(access_s2member_level4)]Please register for PREMIUM VERSION HERE to read full post below containing analysis. In case of any error or you think you are not able to read the full post below, please email us at support#nehcap.com [lwa][/s2If] [s2If current_user_can(access_s2member_level4)]
- Gold price extended its gains on mixed US economic data.
- US CPI cooled down, but Core CPI was unchanged, indicating sticky inflation.
- XAU/USD Price Analysis: Likely to remain bullish, but a drop below $2,000 would pave the way to $1,950.
The pair currently trades last at 2007.69.
The previous day high was 2007.52 while the previous day low was 1988.88. The daily 38.2% Fib levels comes at 2000.4, expected to provide support. Similarly, the daily 61.8% fib level is at 1996.0, expected to provide support.
Gold price resumes to the upside after hitting a low of $2001, following a mixed US inflation report. Furthermore, recent Fed officials’ mixed comments about overtightening monetary policy keep the American Dollar (USD) pressured. At the time of typing, the XAU/USD is trading at $2,005.34, above its opening price by a minuscule 0.11%.
The US Bureau of Labor Statistics (BLS) revealed that March’s Consumer Price Index (CPI) rose less than the 5.2% expected, tumbling from 6% to 5% YoY, in figures revealed ahead of the Wall Street open. Nevertheless, not everything is positive news, as the Core CPI, which excludes volatile items, was unchanged at 5.6% YoY.
The yellow metal reacted upwards, reaching a new daily high at $2,028.32. It has retreated some of those gains as it meanders shy of the $2,010 area. Contrarily, the US Dollar (USD) extended its downtrend to two straight days of losses, as shown by the US Dollar Index (DXY), which measures the performance of six currencies against the USD. The DXY exchanges hands at 101.546, down 0.58%, threatening to dip below the 101.000 mark.
Another reason for Gold’s jump was that US Treasury bond yields dropped sharply, with the 2-year bond yield collapsing 14 bps, before erasing some of those losses. Nevertheless, traders’ bets that the US Federal Reserve (Fed) would continue to tighten monetary conditions stood tall at 67.2% for a 25 bps rate hike, compared to Tuesday’s 72.9%.
Of late, the Richmond Fed President Thomas Barkin said that the report was aligned with expectations but added that although inflation has peaked, “there is still some way to go.” Furthermore, he said that before the May meeting, the PCE and the ECI would be crucial to assess his stance at the upcoming meeting.
Even though XAU/USD prints minuscule gains on Wednesday, price action forms an inverted hammer preceded by an uptrend, usually a bearish candle. Oscillators remain bullish, but the Relative Strength Index (RSI) stopped its uptrend and is sideways, while the Rate of Change (RoC) is almost neutral. For an XAU/USD bullish resumption, buyers need to crack the high at $2,028.32, so they could pose a threat to the YTD high at $2,032.13. Contrarily, the XAU/USD would extend its losses, past the $2,000 figure, with the 20-day EMA being the first demand zone at $1,974.00, followed by February’s 2 high at $1,959.74.
Technical Levels: Supports and Resistances
XAUUSD currently trading at 2007.06 at the time of writing. Pair opened at 2003.83 and is trading with a change of 0.16 % .
| Overview | Overview.1 | |
|---|---|---|
| 0 | Today last price | 2007.06 |
| 1 | Today Daily Change | 3.23 |
| 2 | Today Daily Change % | 0.16 |
| 3 | Today daily open | 2003.83 |
The pair remains strongly bullish on the daily timeframe. It trades above its 20 SMA @ 1973.27, 50 SMA 1901.75, 100 SMA @ 1867.33 and 200 SMA @ 1789.62.
| Trends | Trends.1 | |
|---|---|---|
| 0 | Daily SMA20 | 1973.27 |
| 1 | Daily SMA50 | 1901.75 |
| 2 | Daily SMA100 | 1867.33 |
| 3 | Daily SMA200 | 1789.62 |
The previous day high was 2007.52 while the previous day low was 1988.88. The daily 38.2% Fib levels comes at 2000.4, expected to provide support. Similarly, the daily 61.8% fib level is at 1996.0, expected to provide support.
Note the levels of interest below:
- Pivot support is noted at 1992.63, 1981.44, 1973.99
- Pivot resistance is noted at 2011.27, 2018.72, 2029.91
| Levels | Levels.1 |
|---|---|
| Previous Daily High | 2007.52 |
| Previous Daily Low | 1988.88 |
| Previous Weekly High | 2032.11 |
| Previous Weekly Low | 1949.83 |
| Previous Monthly High | 2009.88 |
| Previous Monthly Low | 1809.46 |
| Daily Fibonacci 38.2% | 2000.40 |
| Daily Fibonacci 61.8% | 1996.00 |
| Daily Pivot Point S1 | 1992.63 |
| Daily Pivot Point S2 | 1981.44 |
| Daily Pivot Point S3 | 1973.99 |
| Daily Pivot Point R1 | 2011.27 |
| Daily Pivot Point R2 | 2018.72 |
| Daily Pivot Point R3 | 2029.91 |
[/s2If]
Join Our Telegram Group
")


