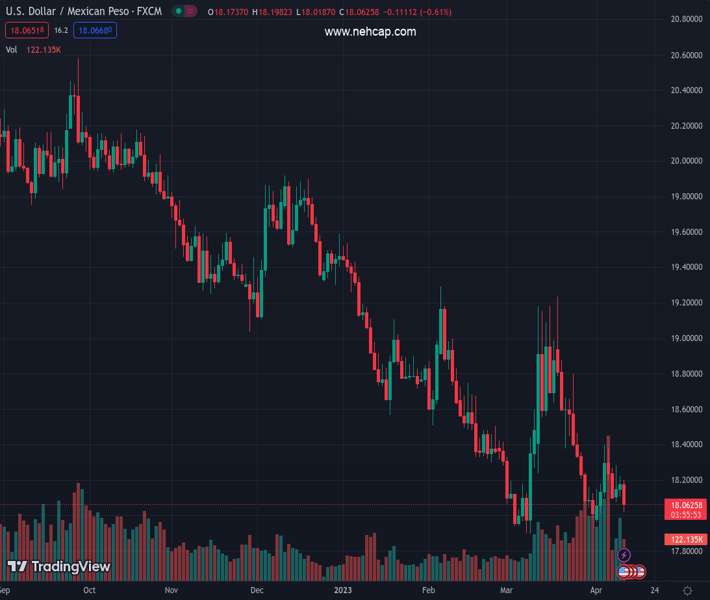
#USDMXN @ 18.0615 reached a daily low shy of cracking 18.00 as a reaction to US CPI data. (Pivot Orderbook analysis)
…
This is a premium post.
[s2If !current_user_can(access_s2member_level4)]Please register for PREMIUM VERSION HERE to read full post below containing analysis. In case of any error or you think you are not able to read the full post below, please email us at support#nehcap.com [lwa][/s2If] [s2If current_user_can(access_s2member_level4)]
- USD/MXN reached a daily low shy of cracking 18.00 as a reaction to US CPI data.
- Sentiment shifted mixed as US core CPI was unchanged, cementing the case for a Fed rate hike in May.
- Federal Reserve officials remain committed to tackling inflation, even though it causes a recession.
The pair currently trades last at 18.0615.
The previous day high was 18.2236 while the previous day low was 18.1062. The daily 38.2% Fib levels comes at 18.1787, expected to provide resistance. Similarly, the daily 61.8% fib level is at 18.151, expected to provide resistance.
The Mexican Peso (MXN) continued to strengthen against the US Dollar (USD), following contradictory US inflation data, which cemented the case for another rate hike by the US Federal Reserve (Fed) at the upcoming May meeting. The USD/MXN is trading at around 18.08, below its opening price by a half percent.
US equities are fluctuating following an important March inflation report. The Consumer Price Index (CPI) rose 5% YoY, below estimates of 5.3% and lower than February’s 6%, showing that Fed’s tightening is indeed working. Nonetheless, excluding volatile items like food and energy, the so-called core CPI rose 5.6% YoY, unchanged compared to the consensus and the prior’s month data.
Given that core CPI remains stickier than expected, the Federal Reserve (Fed) is expected to raise rates by 25 bps at the May meeting. The CME FedWatch Tool shows odds for a 25 bps hike at 66.5%, below Tuesday’s 72.9%.
The USD/MXN edged lower as an initial reaction to the headline, with the USD/MXN pair reaching a new weekly low of 18.0187, before rebounding and stabilizing around current exchange rates. The greenback weakened, as shown by the US Dollar Index (DXY), down 0.59%, at 101.535, weighed by falling US bond yields.
At a certain point, the US 2-year bond yield dropped 14 bps, but so far has erased some of those losses and is back above 4%, down 2 bps.
Meanwhile, Federal Reserve officials posted mixed comments, led by Minnesota’s Fed Neil Kashkari, who commented on Wednesday that tighter monetary conditions and difficult credit conditions could have caused the Silicon Valley Bank (SVB) crisis. But he emphasized, “We need to get inflation down. … If we were to fail to do that, then your job prospects would be really hard.”
Later the Richmond Fed President Thomas Barkin said that the US inflation report was as expected but added that although inflation has peaked, “there is still some way to go.” Furthermore, he said that before the May meeting, the PCE and the ECI would be crucial to assess his stance at the upcoming meeting.
At around 18:00 GMT, the Federal Reserve Open Market Committee (FOMC) will reveal its latest monetary policy meeting minutes. The minutes are expected to show discussions of the latest meeting after the defaults of Silicon Valley Bank and Signature Bank.
The USD/MXN is downward biased, though facing solid support. For a bearish continuation, the USD/MXN pair needs to crack 18.00, to pave the way for a re-test of the YTD low at 17.8968. Otherwise, the emerging market currency could weaken, exposing the 20-day EMA at 18.2533, which USD/MXN buyers would test. Break above, and the USD/MXN could rally to the 50-day EMA at 18.4526.
Technical Levels: Supports and Resistances
USDMXN currently trading at 18.069 at the time of writing. Pair opened at 18.1868 and is trading with a change of -0.65 % .
| Overview | Overview.1 | |
|---|---|---|
| 0 | Today last price | 18.0690 |
| 1 | Today Daily Change | -0.1178 |
| 2 | Today Daily Change % | -0.6500 |
| 3 | Today daily open | 18.1868 |
The pair remains strongly bearish on the daily time frame. It trades below the 20 SMA @ 18.3829, 50 SMA 18.4442, 100 SMA @ 18.8644 and 200 SMA @ 19.4613.
| Trends | Trends.1 | |
|---|---|---|
| 0 | Daily SMA20 | 18.3829 |
| 1 | Daily SMA50 | 18.4442 |
| 2 | Daily SMA100 | 18.8644 |
| 3 | Daily SMA200 | 19.4613 |
The previous day high was 18.2236 while the previous day low was 18.1062. The daily 38.2% Fib levels comes at 18.1787, expected to provide resistance. Similarly, the daily 61.8% fib level is at 18.151, expected to provide resistance.
Note the levels of interest below:
- Pivot support is noted at 18.1207, 18.0547, 18.0033
- Pivot resistance is noted at 18.2382, 18.2896, 18.3556
| Levels | Levels.1 |
|---|---|
| Previous Daily High | 18.2236 |
| Previous Daily Low | 18.1062 |
| Previous Weekly High | 18.4018 |
| Previous Weekly Low | 17.9660 |
| Previous Monthly High | 19.2324 |
| Previous Monthly Low | 17.8977 |
| Daily Fibonacci 38.2% | 18.1787 |
| Daily Fibonacci 61.8% | 18.1510 |
| Daily Pivot Point S1 | 18.1207 |
| Daily Pivot Point S2 | 18.0547 |
| Daily Pivot Point S3 | 18.0033 |
| Daily Pivot Point R1 | 18.2382 |
| Daily Pivot Point R2 | 18.2896 |
| Daily Pivot Point R3 | 18.3556 |
[/s2If]
Join Our Telegram Group
")


