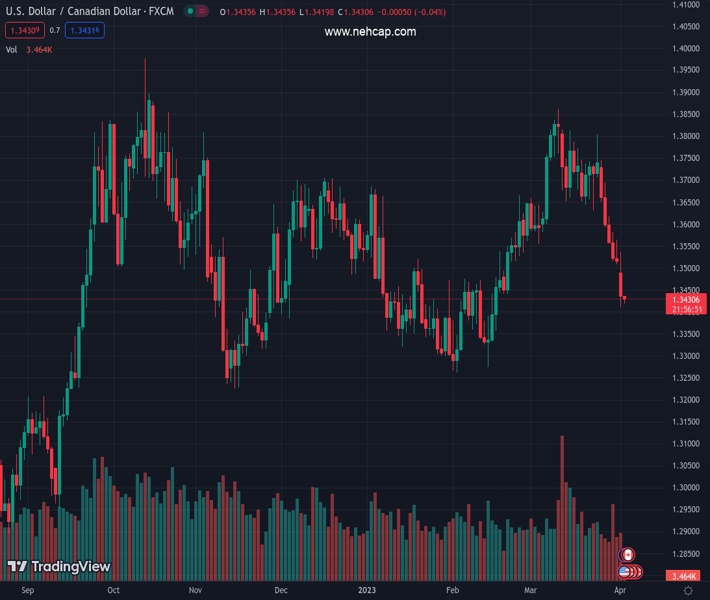
#USDCAD @ 1.34311 has attempted a recovery after dropping to near 1.3410, however, the downside bias is still solid. (Pivot Orderbook analysis)
…
This is a premium post.
[s2If !current_user_can(access_s2member_level4)]Please register for PREMIUM VERSION HERE to read full post below containing analysis. In case of any error or you think you are not able to read the full post below, please email us at support#nehcap.com [lwa][/s2If] [s2If current_user_can(access_s2member_level4)]
- USD/CAD has attempted a recovery after dropping to near 1.3410, however, the downside bias is still solid.
- The USD Index would extend its downside journey on expectations of an early pause in the rate-hiking spell by the Fed.
- Solid oil prices are expected to keep the Canadian Dollar on the front foot.
The pair currently trades last at 1.34311.
The previous day high was 1.3564 while the previous day low was 1.3508. The daily 38.2% Fib levels comes at 1.3529, expected to provide resistance. Similarly, the daily 61.8% fib level is at 1.3543, expected to provide resistance.
The USD/CAD pair has attempted a recovery after dropping to near 1.3410 in the early Asian session. The recovery move by the Loonie asset is expected to turn into a short-lived pullback as the US Dollar Index (DXY) would extend its downside journey on expectations of an early pause in the rate-hiking spell by the Federal Reserve (Fed).
The Loonie asset has registered a six-day losing spell and more downside is in pipeline amid expectations for a further jump in oil prices. It is worth noting that Canada is the leading exporter of oil to the United States and higher oil prices will strengthen the Canadian Dollar.
Going forward, the street is expected to keep its focus on the United States Automatic Data Processing (ADP) Employment Change (March) data, which is scheduled for Wednesday. The economic data is seen lower at 205K vs. the prior release of 242K.
On a four-hour scale, the Loonie asset has shifted below the 61.8% Fibonacci retracement (plotted from February 02 low at 1.3262 to March 10 high at 1.3862) at 1.3493. The major will likely retrace its entire move.
Downward-sloping 10-and 20-period Exponential Moving Averages (EMAs) at 1.3474 and 1.3511 respectively indicate that the bearish momentum is extremely strong.
The Relative Strength Index (RSI) (14) is oscillating in the bearish range of 20.00-40.00, showing active downside momentum, however, an oversold situation cannot be ruled out.
A mean-reversion to near the 10-EMA would offer a bargain sell for investors and the major would continue its downside move toward February 16 low at 1.3357 and February 02 low at 1.3262.
In an alternate scenario, an upside move above the psychological resistance of 1.3500 will shift traction in the favor of US Dollar bulls, which will drive assets towards 50% and 38.2% Fibo retracements at 1.3563 and 1.3633 respectively.
Technical Levels: Supports and Resistances
USDCAD currently trading at 1.343 at the time of writing. Pair opened at 1.3519 and is trading with a change of -0.66 % .
| Overview | Overview.1 | |
|---|---|---|
| 0 | Today last price | 1.3430 |
| 1 | Today Daily Change | -0.0089 |
| 2 | Today Daily Change % | -0.6600 |
| 3 | Today daily open | 1.3519 |
The pair is trading below its 20 Daily moving average @ 1.3695, below its 50 Daily moving average @ 1.3543 , below its 100 Daily moving average @ 1.3522 and above its 200 Daily moving average @ 1.3375
| Trends | Trends.1 | |
|---|---|---|
| 0 | Daily SMA20 | 1.3695 |
| 1 | Daily SMA50 | 1.3543 |
| 2 | Daily SMA100 | 1.3522 |
| 3 | Daily SMA200 | 1.3375 |
The previous day high was 1.3564 while the previous day low was 1.3508. The daily 38.2% Fib levels comes at 1.3529, expected to provide resistance. Similarly, the daily 61.8% fib level is at 1.3543, expected to provide resistance.
Note the levels of interest below:
- Pivot support is noted at 1.3496, 1.3474, 1.344
- Pivot resistance is noted at 1.3553, 1.3587, 1.361
| Levels | Levels.1 |
|---|---|
| Previous Daily High | 1.3564 |
| Previous Daily Low | 1.3508 |
| Previous Weekly High | 1.3745 |
| Previous Weekly Low | 1.3508 |
| Previous Monthly High | 1.3862 |
| Previous Monthly Low | 1.3508 |
| Daily Fibonacci 38.2% | 1.3529 |
| Daily Fibonacci 61.8% | 1.3543 |
| Daily Pivot Point S1 | 1.3496 |
| Daily Pivot Point S2 | 1.3474 |
| Daily Pivot Point S3 | 1.3440 |
| Daily Pivot Point R1 | 1.3553 |
| Daily Pivot Point R2 | 1.3587 |
| Daily Pivot Point R3 | 1.3610 |
[/s2If]
Join Our Telegram Group
")


