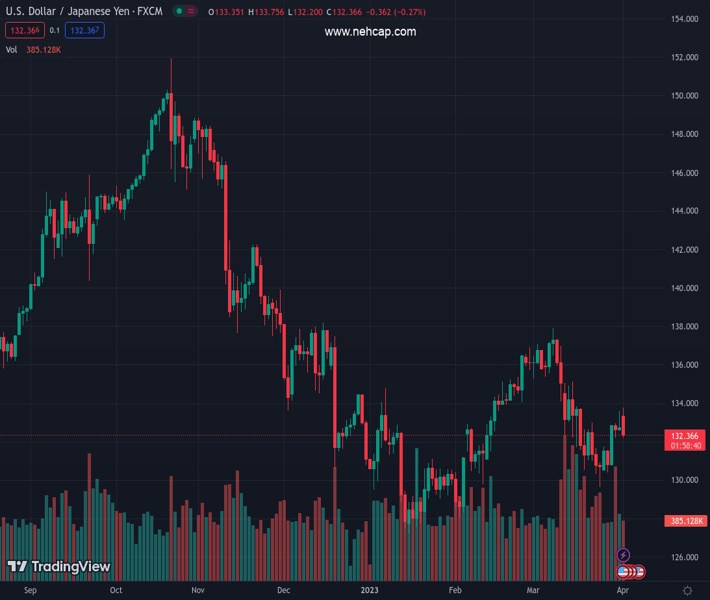
#USDJPY @ 132.349 Bullish momentum faded after the could not break resistance at the 200-DMA. (Pivot Orderbook analysis)
…
This is a premium post.
[s2If !current_user_can(access_s2member_level4)]Please register for PREMIUM VERSION HERE to read full post below containing analysis. In case of any error or you think you are not able to read the full post below, please email us at support#nehcap.com [lwa][/s2If] [s2If current_user_can(access_s2member_level4)]
- Bullish momentum faded after the USD/JPY could not break resistance at the 200-DMA.
- USD/JPY path of least resistance is downwards, with first support at 132.00.
- A fall beyond 132.00, and the USD/JPY could test 131.00.
The pair currently trades last at 132.349.
The previous day high was 133.6 while the previous day low was 132.59. The daily 38.2% Fib levels comes at 133.21, expected to provide resistance. Similarly, the daily 61.8% fib level is at 132.97, expected to provide resistance.
USD/JPY retraces from two-week highs at around 133.75 and extends its losses below the 50-day Exponential Moving Average (EMA) at 133.25 after failing to pierce the 200-day EMA at 133.79. At the time of writing, the USD/JPY is exchanging hands at 132.28, down 0.33%.
From the daily chart perspective, the USD/JPY bullish momentum waned after the pair fell shy of cracking the 200-day EMA. That would’ve exposed the 134.00 figure on the upside, followed by the 100-day EMA at 134.25.
Hence, the USD/JPY resumed its downtrend direction, exacerbated by back-to-back breaks of essential support levels, like the 50 and 20-day EMAs, at 133.25 and 132.72. Additionally, the Relative Strength Index (RSI) failed to crack the 50-mid-line and headed downwards, while the Rate of Change (RoC) began to portray that sellers were gathering momentum.
Therefore, the USD/JPY path of least resistance is downwards. That said, the USD/JPY first support would be 132.00. A breach of the latter will expose the March 27 high at 131.76, followed by an upslope support trendline drawn from January lows that passes around 131.10-20. Once cleared, 131.00 would be next.
Technical Levels: Supports and Resistances
USDJPY currently trading at 132.34 at the time of writing. Pair opened at 132.87 and is trading with a change of -0.4 % .
| Overview | Overview.1 | |
|---|---|---|
| 0 | Today last price | 132.34 |
| 1 | Today Daily Change | -0.53 |
| 2 | Today Daily Change % | -0.40 |
| 3 | Today daily open | 132.87 |
The pair remains strongly bearish on the daily time frame. It trades below the 20 SMA @ 133.27, 50 SMA 132.95, 100 SMA @ 133.87 and 200 SMA @ 137.32.
| Trends | Trends.1 | |
|---|---|---|
| 0 | Daily SMA20 | 133.27 |
| 1 | Daily SMA50 | 132.95 |
| 2 | Daily SMA100 | 133.87 |
| 3 | Daily SMA200 | 137.32 |
The previous day high was 133.6 while the previous day low was 132.59. The daily 38.2% Fib levels comes at 133.21, expected to provide resistance. Similarly, the daily 61.8% fib level is at 132.97, expected to provide resistance.
Note the levels of interest below:
- Pivot support is noted at 132.44, 132.01, 131.43
- Pivot resistance is noted at 133.45, 134.03, 134.46
| Levels | Levels.1 |
|---|---|
| Previous Daily High | 133.60 |
| Previous Daily Low | 132.59 |
| Previous Weekly High | 133.60 |
| Previous Weekly Low | 130.41 |
| Previous Monthly High | 137.91 |
| Previous Monthly Low | 129.64 |
| Daily Fibonacci 38.2% | 133.21 |
| Daily Fibonacci 61.8% | 132.97 |
| Daily Pivot Point S1 | 132.44 |
| Daily Pivot Point S2 | 132.01 |
| Daily Pivot Point S3 | 131.43 |
| Daily Pivot Point R1 | 133.45 |
| Daily Pivot Point R2 | 134.03 |
| Daily Pivot Point R3 | 134.46 |
[/s2If]
Join Our Telegram Group


