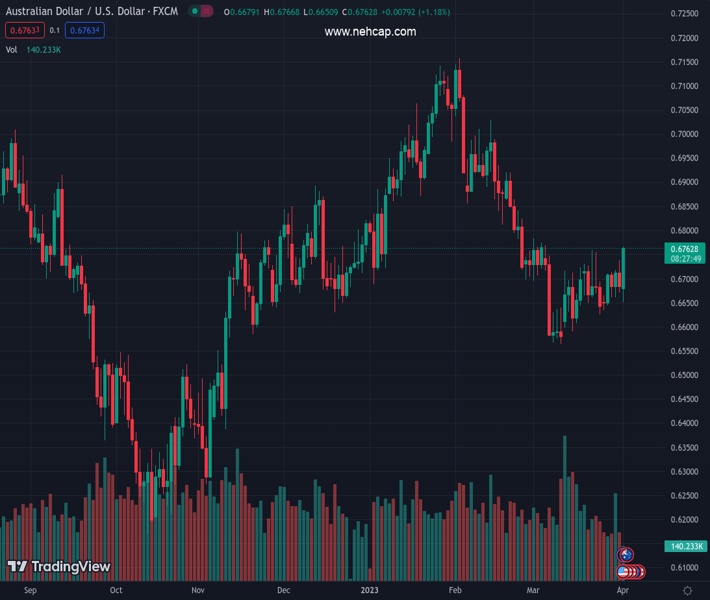
#AUDUSD @ 0.67606 rallies over 100 pips intraday and touches a nearly one-month high on Monday. (Pivot Orderbook analysis)
…
This is a premium post.
[s2If !current_user_can(access_s2member_level4)]Please register for PREMIUM VERSION HERE to read full post below containing analysis. In case of any error or you think you are not able to read the full post below, please email us at support#nehcap.com [lwa][/s2If] [s2If current_user_can(access_s2member_level4)]
- AUD/USD rallies over 100 pips intraday and touches a nearly one-month high on Monday.
- The risk-on mood weighs on the safe-haven USD and benefits the risk-sensitive Aussie.
- Traders now look to the US ISM PMI for some impetus ahead of the RBA on Tuesday.
The pair currently trades last at 0.67606.
The previous day high was 0.6738 while the previous day low was 0.667. The daily 38.2% Fib levels comes at 0.6696, expected to provide support. Similarly, the daily 61.8% fib level is at 0.6712, expected to provide support.
The AUD/USD pair rebounds sharply from a four-day high, around the 0.6650 area touched earlier this Monday and builds on its solid intraday recovery through the mid-European session. Spot prices spike to the 0.6760 area, or a nearly one-month top in the last hour, with bulls making a fresh attempt to build on the momentum further beyond a technically significant 200-day Simple Moving Average (SMA).
As investors digest the potential inflationary impact of a sharp rise in Oil prices, the prevalent risk-on environment attracts fresh sellers around the safe-haven US Dollar (USD) and turns out to be a key factor that benefits the risk-sensitive Aussie. Apart from this, the AUD/USD pair’s strong intraday rally could further be attributed to some short-covering ahead of the Reserve Bank of Australia (RBA) monetary policy meeting on Tuesday. The market optimism, however, is likely to be short-lived amid concerns about a deeper global economic downturn.
The worries resurfaced after data out of Asia on Friday showed that manufacturing activity in Japan contracted during March, while growth in China stalled during the reported month. Furthermore, fresh speculations that rising energy prices might force the Federal Reserve (Fed) to move back to its inflation-fighting rate hikes, which, in turn, favour the USD bulls and might cap the AUD/USD pair. the markets are now pricing in a greater chance of a 25 bps lift-off in May and the bets were lifted by a surprise production cut by OPEC+.
Hence, it will be prudent to wait for a strong follow-through buying around the AUD/USD pair before positioning for a further near-term appreciating move. Heading into the key central bank event risk, traders on Monday will take cues from the US ISM Manufacturing PMI, due later during the early North American session. This week’s busy US economic docket also features the ADP report on private-sector employment and ISM Services PMI on Wednesday, followed by the crucial US monthly employment report – popularly known as NFP on Friday.
Technical Levels: Supports and Resistances
AUDUSD currently trading at 0.6762 at the time of writing. Pair opened at 0.6686 and is trading with a change of 1.14 % .
| Overview | Overview.1 | |
|---|---|---|
| 0 | Today last price | 0.6762 |
| 1 | Today Daily Change | 0.0076 |
| 2 | Today Daily Change % | 1.1400 |
| 3 | Today daily open | 0.6686 |
The pair is trading above its 20 Daily moving average @ 0.6662, below its 50 Daily moving average @ 0.6819 , below its 100 Daily moving average @ 0.68 and above its 200 Daily moving average @ 0.6752
| Trends | Trends.1 | |
|---|---|---|
| 0 | Daily SMA20 | 0.6662 |
| 1 | Daily SMA50 | 0.6819 |
| 2 | Daily SMA100 | 0.6800 |
| 3 | Daily SMA200 | 0.6752 |
The previous day high was 0.6738 while the previous day low was 0.667. The daily 38.2% Fib levels comes at 0.6696, expected to provide support. Similarly, the daily 61.8% fib level is at 0.6712, expected to provide support.
Note the levels of interest below:
- Pivot support is noted at 0.6658, 0.6631, 0.6591
- Pivot resistance is noted at 0.6725, 0.6765, 0.6793
| Levels | Levels.1 |
|---|---|
| Previous Daily High | 0.6738 |
| Previous Daily Low | 0.6670 |
| Previous Weekly High | 0.6738 |
| Previous Weekly Low | 0.6634 |
| Previous Monthly High | 0.6784 |
| Previous Monthly Low | 0.6564 |
| Daily Fibonacci 38.2% | 0.6696 |
| Daily Fibonacci 61.8% | 0.6712 |
| Daily Pivot Point S1 | 0.6658 |
| Daily Pivot Point S2 | 0.6631 |
| Daily Pivot Point S3 | 0.6591 |
| Daily Pivot Point R1 | 0.6725 |
| Daily Pivot Point R2 | 0.6765 |
| Daily Pivot Point R3 | 0.6793 |
[/s2If]
Join Our Telegram Group


