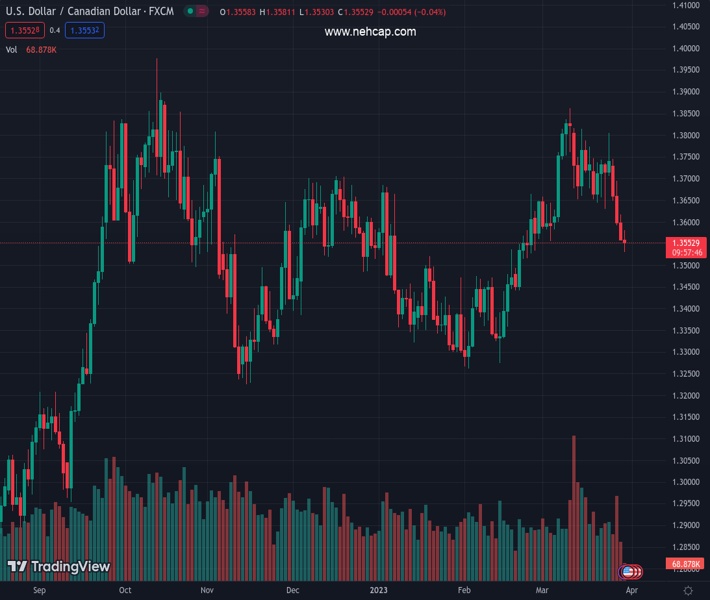
#USDCAD @ 1.35531 drifts lower for the fourth straight day and is pressured by a combination of factors. (Pivot Orderbook analysis)
…
This is a premium post.
[s2If !current_user_can(access_s2member_level4)]Please register for PREMIUM VERSION HERE to read full post below containing analysis. In case of any error or you think you are not able to read the full post below, please email us at support#nehcap.com [lwa][/s2If] [s2If current_user_can(access_s2member_level4)]
- USD/CAD drifts lower for the fourth straight day and is pressured by a combination of factors.
- The risk-on mood weighs on the USD and acts as a headwind amid a fresh leg up in Oil prices.
- Spot prices find some support ahead of the 100-day SMA as traders look to the US macro data.
The pair currently trades last at 1.35531.
The previous day high was 1.3617 while the previous day low was 1.3557. The daily 38.2% Fib levels comes at 1.358, expected to provide resistance. Similarly, the daily 61.8% fib level is at 1.3594, expected to provide resistance.
The USD/CAD pair remains under some selling pressure for the fourth successive day on Thursday and drops to over a one-month low during the first half of the European session. The pair, however, manages to rebound a few pips in the last hour and is currently placed around mid-1.3500s, down less than 0.10% for the day.
The prevalent risk-on environment – as depicted by an extension of the recent rally in the equity markets – exerts fresh downward pressure on the safe-haven US Dollar (USD) and turns out to be a key factor acting as a headwind for the USD/CAD pair. The takeover of Silicon Valley Bank by First Citizens Bank & Trust Company helped calmed market nerves about the contagion risk. Furthermore, no further cracks have emerged in the banking sector over the past two weeks, which suggests that a full-blown banking crisis might have been averted and drives flows away from traditional safe-haven assets, including the Greenback.
Apart from a modest USD weakness, a fresh leg up in Crude Oil prices underpins the commodity-linked Loonie and contributes to the offered tone surrounding the USD/CAD pair. A surprise drop in US Crude stockpiles to a two-year low and concerns about tightening global supplies assist the black liquid to regain positive traction following the overnight pullback from over a two-week high. In fact, the Energy Information Administration reported an unexpected fall in US inventories to a two-year low
during the week of March 24. Moreover, exports from Iraq’s northern region remain halted and lend support to Oil prices.
The USD/CAD pair, however, manages to find some support ahead of a technically significant 100-day Simple Moving Average (SMA) as traders keenly await the US inflation data due on Friday. The US Core PCE Price Index – the Fed’s preferred inflation gauge – will play a key role in influencing market expectations about future rate hikes. This, in turn, will drive the USD demand and provide a fresh directional impetus to the major. In the meantime, traders on Thursday will take cues from Thursday’s US economic docket, featuring the release of the final Q4 GDP print and the usual Weekly Initial Jobless Claims data.
Technical Levels: Supports and Resistances
USDCAD currently trading at 1.3546 at the time of writing. Pair opened at 1.3559 and is trading with a change of -0.1 % .
| Overview | Overview.1 | |
|---|---|---|
| 0 | Today last price | 1.3546 |
| 1 | Today Daily Change | -0.0013 |
| 2 | Today Daily Change % | -0.1000 |
| 3 | Today daily open | 1.3559 |
The pair is trading below its 20 Daily moving average @ 1.3702, above its 50 Daily moving average @ 1.3539 , above its 100 Daily moving average @ 1.3517 and above its 200 Daily moving average @ 1.3369
| Trends | Trends.1 | |
|---|---|---|
| 0 | Daily SMA20 | 1.3702 |
| 1 | Daily SMA50 | 1.3539 |
| 2 | Daily SMA100 | 1.3517 |
| 3 | Daily SMA200 | 1.3369 |
The previous day high was 1.3617 while the previous day low was 1.3557. The daily 38.2% Fib levels comes at 1.358, expected to provide resistance. Similarly, the daily 61.8% fib level is at 1.3594, expected to provide resistance.
Note the levels of interest below:
- Pivot support is noted at 1.3538, 1.3517, 1.3478
- Pivot resistance is noted at 1.3598, 1.3637, 1.3658
| Levels | Levels.1 |
|---|---|
| Previous Daily High | 1.3617 |
| Previous Daily Low | 1.3557 |
| Previous Weekly High | 1.3804 |
| Previous Weekly Low | 1.3631 |
| Previous Monthly High | 1.3666 |
| Previous Monthly Low | 1.3262 |
| Daily Fibonacci 38.2% | 1.3580 |
| Daily Fibonacci 61.8% | 1.3594 |
| Daily Pivot Point S1 | 1.3538 |
| Daily Pivot Point S2 | 1.3517 |
| Daily Pivot Point S3 | 1.3478 |
| Daily Pivot Point R1 | 1.3598 |
| Daily Pivot Point R2 | 1.3637 |
| Daily Pivot Point R3 | 1.3658 |
[/s2If]
Join Our Telegram Group
")


