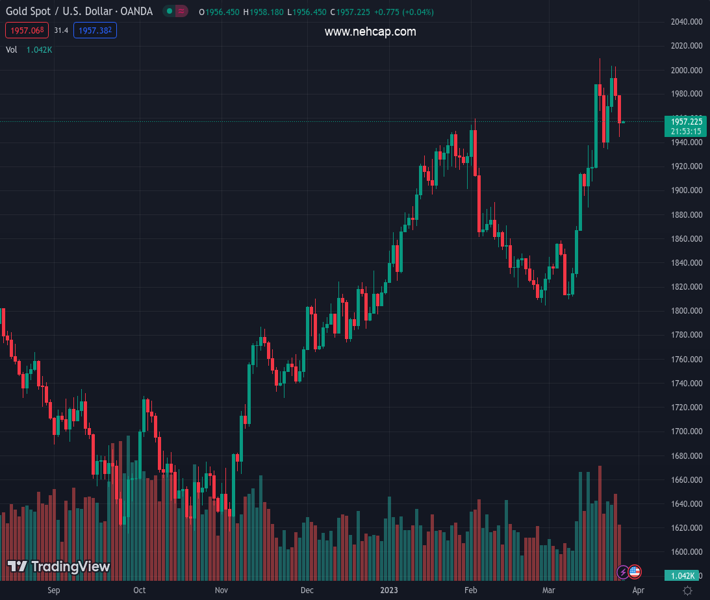
#XAUUSD @ 1,957.41 Gold price is sensing barricades around $1,960.00 as fears of US banking turmoil have eased. (Pivot Orderbook analysis)
…
This is a premium post.
[s2If !current_user_can(access_s2member_level4)]Please register for PREMIUM VERSION HERE to read full post below containing analysis. In case of any error or you think you are not able to read the full post below, please email us at support#nehcap.com [lwa][/s2If] [s2If current_user_can(access_s2member_level4)]
- Gold price is sensing barricades around $1,960.00 as fears of US banking turmoil have eased.
- Appeal for Gold and US government bonds as safe-haven amid US banking jitters has trimmed dramatically.
- Risk appetite is improving further on hopes that US banking recovery will be faster.
The pair currently trades last at 1957.41.
The previous day high was 2003.07 while the previous day low was 1975.28. The daily 38.2% Fib levels comes at 1985.9, expected to provide resistance. Similarly, the daily 61.8% fib level is at 1992.45, expected to provide resistance.
Gold price (XAU/USD) is juggling below $1,960.00 in the early Asian session. The upside for the Gold price seems restricted as fears of the United States banking debacle have eased. Therefore, investors have liquidated their positions in Gold and US government bonds, which were considered safe-haven amid banking jitters.
On Monday, First Citizens BancShares said it would take on the deposits and loans of failed Silicon Valley Bank (SVB). The news came after Bloomberg reported that US authorities are looking to expand the emergency lending facility for small banks amid turbulent times. Back-to-back supportive headlines for the US banking system infused confidence among the market participants.
Meanwhile, S&P500 futures are showing nominal gains after a bullish Monday on hopes that US banking recovery will be faster and chances of banking turmoil like the 2008 financial crisis are extremely lower. Easing US baking jitters impacted the demand for US government bonds heavily. This led to a perpendicular rise in 10-year US Treasury yields to 3.54%.
The US Dollar Index (DXY) has corrected to near 102.83 as hopes for a sooner conclusion of the rate-hiking spell by the Federal Reserve (Fed) are escalating.
Fed Governor Philip Jefferson cited on Monday, “Inflation ‘should fall back’ toward the Fed’s 2% target as higher interest rates discourage spending in interest-rate sensitive sectors of the economy like housing,” as reported by Reuters. He further added, would like to say inflation will return to 2% soon, but have to avoid damaging the economy ‘any more than is necessary’.
Gold price has shown a sheer fall after forming a Double Top chart pattern on an hourly scale plotted from March 23 high at $2,003.37. The precious metal re-tested critical resistance with less buying strength, which triggered aggressive selling from responsive sellers. Gold price is declining towards the horizontal support placed from March 15 high at $1,937.39. The yearly high is placed from March 20 high at $2,009.88.
The 20-period Exponential Moving Average (EMA) will continue to act as a barricade for the Gold bulls.
Meanwhile, the Relative Strength Index (RSI) (14) is making efforts in shifting its range to 40.00-60.00.
Technical Levels: Supports and Resistances
XAUUSD currently trading at 1957.72 at the time of writing. Pair opened at 1977.45 and is trading with a change of -1.0 % .
| Overview | Overview.1 | |
|---|---|---|
| 0 | Today last price | 1957.72 |
| 1 | Today Daily Change | -19.73 |
| 2 | Today Daily Change % | -1.00 |
| 3 | Today daily open | 1977.45 |
The pair remains strongly bullish on the daily timeframe. It trades above its 20 SMA @ 1892.66, 50 SMA 1887.93, 100 SMA @ 1840.48 and 200 SMA @ 1780.47.
| Trends | Trends.1 | |
|---|---|---|
| 0 | Daily SMA20 | 1892.66 |
| 1 | Daily SMA50 | 1887.93 |
| 2 | Daily SMA100 | 1840.48 |
| 3 | Daily SMA200 | 1780.47 |
The previous day high was 2003.07 while the previous day low was 1975.28. The daily 38.2% Fib levels comes at 1985.9, expected to provide resistance. Similarly, the daily 61.8% fib level is at 1992.45, expected to provide resistance.
Note the levels of interest below:
- Pivot support is noted at 1967.46, 1957.48, 1939.67
- Pivot resistance is noted at 1995.25, 2013.06, 2023.04
| Levels | Levels.1 |
|---|---|
| Previous Daily High | 2003.07 |
| Previous Daily Low | 1975.28 |
| Previous Weekly High | 2009.88 |
| Previous Weekly Low | 1934.34 |
| Previous Monthly High | 1959.80 |
| Previous Monthly Low | 1804.76 |
| Daily Fibonacci 38.2% | 1985.90 |
| Daily Fibonacci 61.8% | 1992.45 |
| Daily Pivot Point S1 | 1967.46 |
| Daily Pivot Point S2 | 1957.48 |
| Daily Pivot Point S3 | 1939.67 |
| Daily Pivot Point R1 | 1995.25 |
| Daily Pivot Point R2 | 2013.06 |
| Daily Pivot Point R3 | 2023.04 |
[/s2If]
Join Our Telegram Group


