Asian stocks are facing the heat as investors turn anxious ahead of global PMIs data. (Pivot Orderbook analysis)
…
This is a premium post.
[s2If !current_user_can(access_s2member_level4)]Please register for PREMIUM VERSION HERE to read full post below containing analysis. In case of any error or you think you are not able to read the full post below, please email us at support#nehcap.com [lwa][/s2If] [s2If current_user_can(access_s2member_level4)]
- Asian stocks are facing the heat as investors turn anxious ahead of global PMIs data.
- The US banking fiasco has triggered economic fears as US banks would tighten credit conditions.
- Significant softening of Japan’s inflation could attract monetary stimulus from the government.
The pair currently trades last at 27326.8.
The previous day high was 27616.49 while the previous day low was 27174.07. The daily 38.2% Fib levels comes at 27447.49, expected to provide resistance. Similarly, the daily 61.8% fib level is at 27343.07, expected to provide resistance.
Markets in the Asian domain are showing roots of caution as investors are shifting their focus toward the release of the global Purchasing Managers Index (PMIs). Anxiety ahead of global PMI figures has joined potential banking woes, which has forced investors to make distance with Asian equities. S&P500 futures have turned choppy after a significant recovery on Thursday as investors are worried about the likely tightening of credit conditions by the United States banks after a shakedown.
Federal Reserve (Fed) chair Jerome Powell confirmed in his statement that US banks are likely to be more precautionary while disbursing loans to households and businesses, which would impact the overall demand, inflation, and the scale of economic activities. Also, outflows of funds to developing economies could scale lower.
At the press time, Japan’s Nikkei225 dropped 0.34%, ChinaA50 slipped 0.27%, Hang Seng eased 0.18%, and Nifty50 remained sideways.
Japanese stocks failed to show an action despite rising expectations of more stimulus from the administration after the sheer softening of the National Consumer Price Index (CPI). Headline CPI has dropped significantly to 3.3% from the consensus of 4.1% and the former release of 4.3%. The core inflation that strips off oil and food prices scaled higher to 3.5% from the estimates of 3.4% and the prior print of 3.3%.
A scrutiny of Japan’s inflation data indicates that the recent decline in oil prices has battered the headline figure. And higher core CPI could be the outcome of efforts made by the Japanese government to accelerate wages.
Meanwhile, China’s Ministry of Commerce has urged to the US to remove trade restrictions citing that the former is not seeking to engineer a trade surplus with the latter.
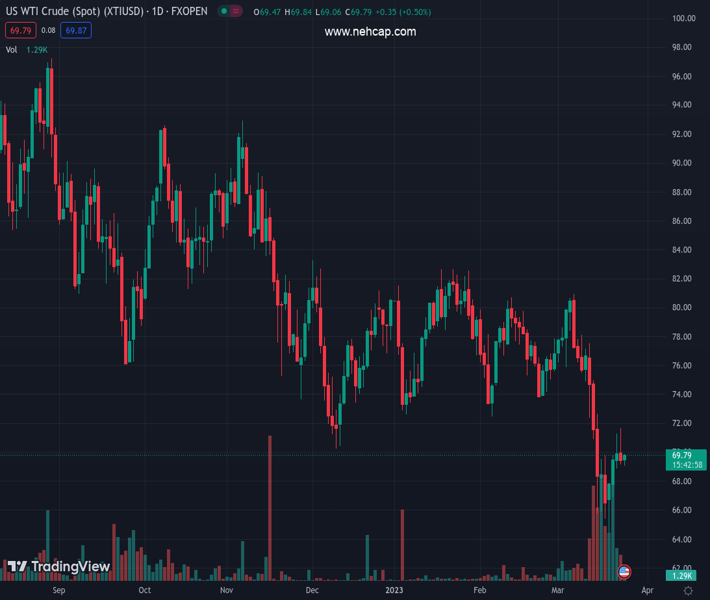
On the oil front, oil prices have rebounded firmly after dropping to near $69.00 as the street is anticipating a rally in commodities led by weakness in the US Dollar. Investors believe that a consideration of a pause in the policy-tightening process by the Fed would push the US Dollar into a negative trajectory for a longer period.
Technical Levels: Supports and Resistances
XTIUSD currently trading at 27326.8 at the time of writing. Pair opened at 27326.8 and is trading with a change of 0.0 % .
| Overview | Overview.1 | |
|---|---|---|
| 0 | Today last price | 27326.8 |
| 1 | Today Daily Change | 0.0 |
| 2 | Today Daily Change % | 0.0 |
| 3 | Today daily open | 27326.8 |
The pair remains strongly bearish on the daily time frame. It trades below the 20 SMA @ 27585.11, 50 SMA 27393.98, 100 SMA @ 27339.91 and 200 SMA @ 27339.98.
| Trends | Trends.1 | |
|---|---|---|
| 0 | Daily SMA20 | 27585.11 |
| 1 | Daily SMA50 | 27393.98 |
| 2 | Daily SMA100 | 27339.91 |
| 3 | Daily SMA200 | 27339.98 |
The previous day high was 27616.49 while the previous day low was 27174.07. The daily 38.2% Fib levels comes at 27447.49, expected to provide resistance. Similarly, the daily 61.8% fib level is at 27343.07, expected to provide resistance.
Note the levels of interest below:
- Pivot support is noted at 27128.42, 26930.03, 26686.0
- Pivot resistance is noted at 27570.84, 27814.87, 28013.26
| Levels | Levels.1 |
|---|---|
| Previous Daily High | 27616.49 |
| Previous Daily Low | 27174.07 |
| Previous Weekly High | 27921.99 |
| Previous Weekly Low | 26446.43 |
| Previous Monthly High | 27812.68 |
| Previous Monthly Low | 26985.47 |
| Daily Fibonacci 38.2% | 27447.49 |
| Daily Fibonacci 61.8% | 27343.07 |
| Daily Pivot Point S1 | 27128.42 |
| Daily Pivot Point S2 | 26930.03 |
| Daily Pivot Point S3 | 26686.00 |
| Daily Pivot Point R1 | 27570.84 |
| Daily Pivot Point R2 | 27814.87 |
| Daily Pivot Point R3 | 28013.26 |
[/s2If]
Join Our Telegram Group
")


