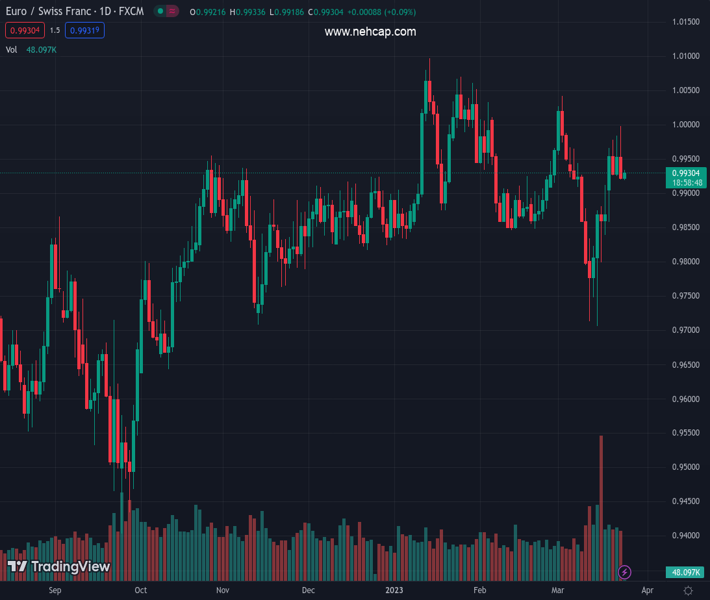
#EURCHF @ 0.99291 has delivered a break below 0.9934 as the SNB left room open for more rates after a 50 bps rate hike. (Pivot Orderbook analysis)
…
This is a premium post.
[s2If !current_user_can(access_s2member_level4)]Please register for PREMIUM VERSION HERE to read full post below containing analysis. In case of any error or you think you are not able to read the full post below, please email us at support#nehcap.com [lwa][/s2If] [s2If current_user_can(access_s2member_level4)]
- EUR/CHF has delivered a break below 0.9934 as the SNB left room open for more rates after a 50 bps rate hike.
- The cross has breakdown the higher lows structure after challenging March 21 low at 0.9926.
- A bear cross, represented by the 20-and 50-period EMAs at 0.9954, indicates more weakness ahead.
The pair currently trades last at 0.99291.
The previous day high was 0.9998 while the previous day low was 0.992. The daily 38.2% Fib levels comes at 0.995, expected to provide resistance. Similarly, the daily 61.8% fib level is at 0.9968, expected to provide resistance.
The EUR/CHF pair has retreated after a short-lived recovery to near 0.9934 in the Asian session. The asset witnessed a steep fall on Thursday after the Swiss National Bank (SNB) hiked rates by 50 basis points (bps) to 1.50% despite fears of financial instability propelled by the demise of Credit Suisse.
After hiking the interest rate, SNB Chairman Thomas J. Jordan cited “We are raising rates to counter the renewed increase in inflationary pressure. The guidance on interest rates from SNB Jordan was also hawkish as the central bank is ready to raise rates further to ensure price stability.
On the Eurozone front, investors will keep an eye on preliminary S&P Global PMI (March) figures. As per the consensus, the Manufacturing PMI is seen at 49.0, higher than the prior release of 48.5. While the Services PMI might decline to 52.5 from the former release of 52.7.
EUR/CHF has breakdown the higher lows structure after challenging March 21 low at 0.9926 on an hourly scale. The downside bias for the cross was built after a negative bearish divergence, which showed exhaustion in the upside momentum. It is worth noting that the Relative Strength Index (RSI) (14) formed a lower high while the asset was continuously forming higher highs.
A bear cross, represented by the 20-and 50-period Exponential Moving Averages (EMAs) at 0.9954, indicates more weakness ahead.
The RSI (14) has also slipped into the bearish range of 20.00-40.00, which indicates that the bearish momentum is active.
More losses would be discovered if the cross slips below March 23 low at 0.9920, which will drag the asset toward March 15 high at 0.9883 followed by the round-level support at 0.9800.
On the flip side, a decisive break above March 20 high at 0.9966 will drive the cross toward the psychological resistance at 1.0000 followed by March 02 high at 1.0042.
Technical Levels: Supports and Resistances
EURCHF currently trading at 0.9928 at the time of writing. Pair opened at 0.9928 and is trading with a change of 0.0 % .
| Overview | Overview.1 | |
|---|---|---|
| 0 | Today last price | 0.9928 |
| 1 | Today Daily Change | 0.0000 |
| 2 | Today Daily Change % | 0.0000 |
| 3 | Today daily open | 0.9928 |
The pair is trading above its 20 Daily moving average @ 0.9913, below its 50 Daily moving average @ 0.993 , above its 100 Daily moving average @ 0.9897 and above its 200 Daily moving average @ 0.9842
| Trends | Trends.1 | |
|---|---|---|
| 0 | Daily SMA20 | 0.9913 |
| 1 | Daily SMA50 | 0.9930 |
| 2 | Daily SMA100 | 0.9897 |
| 3 | Daily SMA200 | 0.9842 |
The previous day high was 0.9998 while the previous day low was 0.992. The daily 38.2% Fib levels comes at 0.995, expected to provide resistance. Similarly, the daily 61.8% fib level is at 0.9968, expected to provide resistance.
Note the levels of interest below:
- Pivot support is noted at 0.9899, 0.9871, 0.9821
- Pivot resistance is noted at 0.9977, 1.0026, 1.0055
| Levels | Levels.1 |
|---|---|
| Previous Daily High | 0.9998 |
| Previous Daily Low | 0.9920 |
| Previous Weekly High | 0.9913 |
| Previous Weekly Low | 0.9706 |
| Previous Monthly High | 1.0033 |
| Previous Monthly Low | 0.9847 |
| Daily Fibonacci 38.2% | 0.9950 |
| Daily Fibonacci 61.8% | 0.9968 |
| Daily Pivot Point S1 | 0.9899 |
| Daily Pivot Point S2 | 0.9871 |
| Daily Pivot Point S3 | 0.9821 |
| Daily Pivot Point R1 | 0.9977 |
| Daily Pivot Point R2 | 1.0026 |
| Daily Pivot Point R3 | 1.0055 |
[/s2If]
Join Our Telegram Group
")


