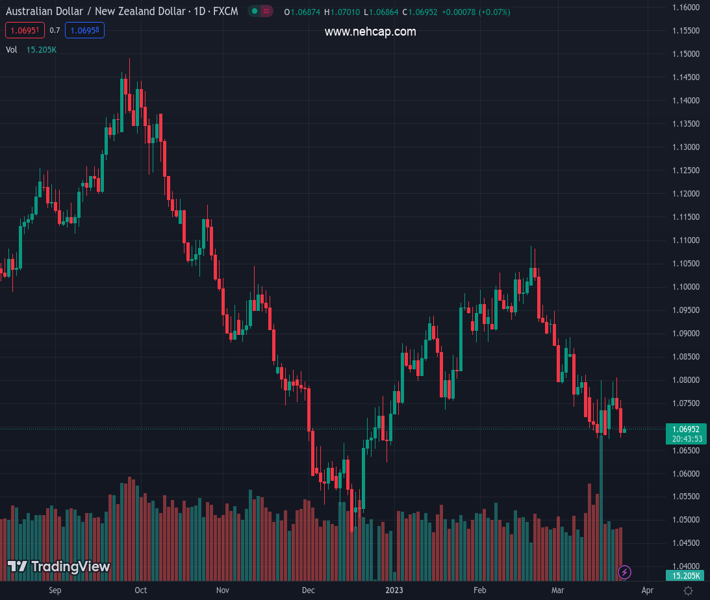
#AUDNZD @ 1.06943 is facing barricades around 1.0700 on weaker-than-projected preliminary Australian PMI data. (Pivot Orderbook analysis)
…
This is a premium post.
[s2If !current_user_can(access_s2member_level4)]Please register for PREMIUM VERSION HERE to read full post below containing analysis. In case of any error or you think you are not able to read the full post below, please email us at support#nehcap.com [lwa][/s2If] [s2If current_user_can(access_s2member_level4)]
- AUD/NZD is facing barricades around 1.0700 on weaker-than-projected preliminary Australian PMI data.
- Preliminary Manufacturing and Services PMI have contracted to 48.7 and 48.2 respectively.
- New Zealand’s growth rate is expected to hit badly as the consequences of the flood situation will be reflected ahead.
The pair currently trades last at 1.06943.
The previous day high was 1.0757 while the previous day low was 1.0676. The daily 38.2% Fib levels comes at 1.0707, expected to provide resistance. Similarly, the daily 61.8% fib level is at 1.0726, expected to provide resistance.
The AUD/NZD pair is struggling to recapture the round-level resistance of 1.0700 in the Asian session. The release of the downbeat preliminary Australian S&P Global PMI data has impacted the Australian Dollar. The Manufacturing PMI has landed at 48.7, lower than the consensus of 50.3 and the former release of 50.5. Also, the Services PMI has dropped significantly to 48.2 from the expectations of 49.9 and the prior print of 50.7.
It looks like higher rates from the Reserve Bank of Australia (RBA) have trimmed the scale of economic activities dramatically. Households with lower funds are struggling to offset the inflated prices of goods and services, which have forced producers to operate with less capacity. Lower output signifies weak retail demand that might result in inflation softening and will delight RBA policymakers.
Investors should be aware that the RBA has already pushed its Official Cash Rate (OCR) to 3.60%. RBA policymakers have started considering a pause in its Quantitative tightening program from April to assess the impact of current monetary policy.
Next week, monthly Australia’s Retail Sales (Feb) data will be keenly watched, which is expected to expand by 0.4% lower than the former expansion of 1.9%. The least expansion in retail demand would bolster hopes for further deceleration in the Australian Consumer Price Index (CPI) ahead.
Meanwhile, the New Zealand Dollar is expected to remain on tenterhooks as New Zealand’s growth rate is expected to hit badly due to the flood situation. The NZ economy would require plenty of time to attain full recovery. The economy is still worried about elevated inflation, which is impacting households dramatically. More rate hikes are expected from the Reserve Bank of New Zealand (RBNZ) to bring down inflation meaningfully.
Technical Levels: Supports and Resistances
AUDNZD currently trading at 1.0697 at the time of writing. Pair opened at 1.0696 and is trading with a change of 0.01 % .
| Overview | Overview.1 | |
|---|---|---|
| 0 | Today last price | 1.0697 |
| 1 | Today Daily Change | 0.0001 |
| 2 | Today Daily Change % | 0.0100 |
| 3 | Today daily open | 1.0696 |
The pair remains strongly bearish on the daily time frame. It trades below the 20 SMA @ 1.0785, 50 SMA 1.0876, 100 SMA @ 1.0816 and 200 SMA @ 1.0976.
| Trends | Trends.1 | |
|---|---|---|
| 0 | Daily SMA20 | 1.0785 |
| 1 | Daily SMA50 | 1.0876 |
| 2 | Daily SMA100 | 1.0816 |
| 3 | Daily SMA200 | 1.0976 |
The previous day high was 1.0757 while the previous day low was 1.0676. The daily 38.2% Fib levels comes at 1.0707, expected to provide resistance. Similarly, the daily 61.8% fib level is at 1.0726, expected to provide resistance.
Note the levels of interest below:
- Pivot support is noted at 1.0662, 1.0629, 1.0581
- Pivot resistance is noted at 1.0744, 1.0791, 1.0825
| Levels | Levels.1 |
|---|---|
| Previous Daily High | 1.0757 |
| Previous Daily Low | 1.0676 |
| Previous Weekly High | 1.0799 |
| Previous Weekly Low | 1.0675 |
| Previous Monthly High | 1.1087 |
| Previous Monthly Low | 1.0877 |
| Daily Fibonacci 38.2% | 1.0707 |
| Daily Fibonacci 61.8% | 1.0726 |
| Daily Pivot Point S1 | 1.0662 |
| Daily Pivot Point S2 | 1.0629 |
| Daily Pivot Point S3 | 1.0581 |
| Daily Pivot Point R1 | 1.0744 |
| Daily Pivot Point R2 | 1.0791 |
| Daily Pivot Point R3 | 1.0825 |
[/s2If]
Join Our Telegram Group
")


