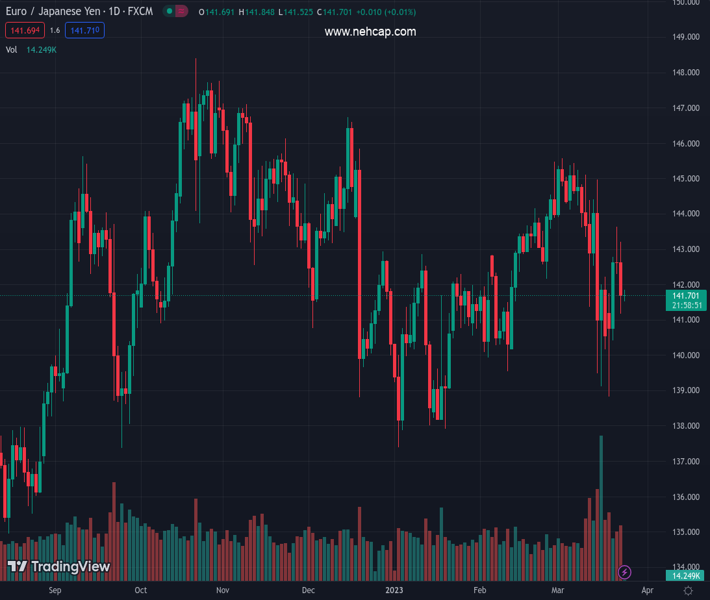
#EURJPY @ 141.730 opens the Asian session with minuscule gains of 0.08%. (Pivot Orderbook analysis)
…
This is a premium post.
[s2If !current_user_can(access_s2member_level4)]Please register for PREMIUM VERSION HERE to read full post below containing analysis. In case of any error or you think you are not able to read the full post below, please email us at support#nehcap.com [lwa][/s2If] [s2If current_user_can(access_s2member_level4)]
- EUR/JPY opens the Asian session with minuscule gains of 0.08%.
- An evening star in the EUR/JPY daily chart could drive prices lower.
- For a bullish resumption, EUR/JPY buyers must reclaim 142.00.
The pair currently trades last at 141.730.
The previous day high was 143.63 while the previous day low was 142.3. The daily 38.2% Fib levels comes at 143.12, expected to provide resistance. Similarly, the daily 61.8% fib level is at 142.81, expected to provide resistance.
EUR/JPY fell for the second straight day, as the Euro (EUR) weakened despite European Central Bank (ECB) members’ hawkish rhetoric. In the early Asian session, the EUR/JPY is trading at 141.83, above its opening price by 0.10%, after hitting a weekly high of 143.63 on Wednesday.
The EUR/JPY daily chart portrays the formation of a three-candlestick chart pattern, an evening star, which implies that the pair might be headed lower. However, Japanese Yen (JPY) bulls must reclaim 141.61, so the EUR/JPY could test the 200-day Exponential Moving Average (EMA) at 141.05. A breach of the latter could open the door for further downside.
Conversely, if Euro (EUR) bulls move in and reclaim 142.00, that could pave the way for them to reclaim the 100-day EMA and the confluence of the 20/50-day EMAs. Once the EUR/JPY breaks above 142.00, the 100-day EMA at 142.33 would be challenged. Upside risks lie at the confluence of the 20/50-day EMA at 142.55/60, on its way toward 143.00.
Oscillators like the Relative Strength Index (RSI) are in bearish territory but shifted flat, and meaning sellers are taking a respite. The Rate of Change (RoC) shifted gears and turned bearish, signaling that sellers are in control.
Technical Levels: Supports and Resistances
EURJPY currently trading at 141.78 at the time of writing. Pair opened at 142.71 and is trading with a change of -0.65 % .
| Overview | Overview.1 | |
|---|---|---|
| 0 | Today last price | 141.78 |
| 1 | Today Daily Change | -0.93 |
| 2 | Today Daily Change % | -0.65 |
| 3 | Today daily open | 142.71 |
The pair remains strongly bearish on the daily time frame. It trades below the 20 SMA @ 143.44, 50 SMA 142.17, 100 SMA @ 142.73 and 200 SMA @ 141.83.
| Trends | Trends.1 | |
|---|---|---|
| 0 | Daily SMA20 | 143.44 |
| 1 | Daily SMA50 | 142.17 |
| 2 | Daily SMA100 | 142.73 |
| 3 | Daily SMA200 | 141.83 |
The previous day high was 143.63 while the previous day low was 142.3. The daily 38.2% Fib levels comes at 143.12, expected to provide resistance. Similarly, the daily 61.8% fib level is at 142.81, expected to provide resistance.
Note the levels of interest below:
- Pivot support is noted at 142.13, 141.56, 140.81
- Pivot resistance is noted at 143.46, 144.2, 144.78
| Levels | Levels.1 |
|---|---|
| Previous Daily High | 143.63 |
| Previous Daily Low | 142.30 |
| Previous Weekly High | 144.96 |
| Previous Weekly Low | 139.13 |
| Previous Monthly High | 145.47 |
| Previous Monthly Low | 139.55 |
| Daily Fibonacci 38.2% | 143.12 |
| Daily Fibonacci 61.8% | 142.81 |
| Daily Pivot Point S1 | 142.13 |
| Daily Pivot Point S2 | 141.56 |
| Daily Pivot Point S3 | 140.81 |
| Daily Pivot Point R1 | 143.46 |
| Daily Pivot Point R2 | 144.20 |
| Daily Pivot Point R3 | 144.78 |
[/s2If]
Join Our Telegram Group
")


