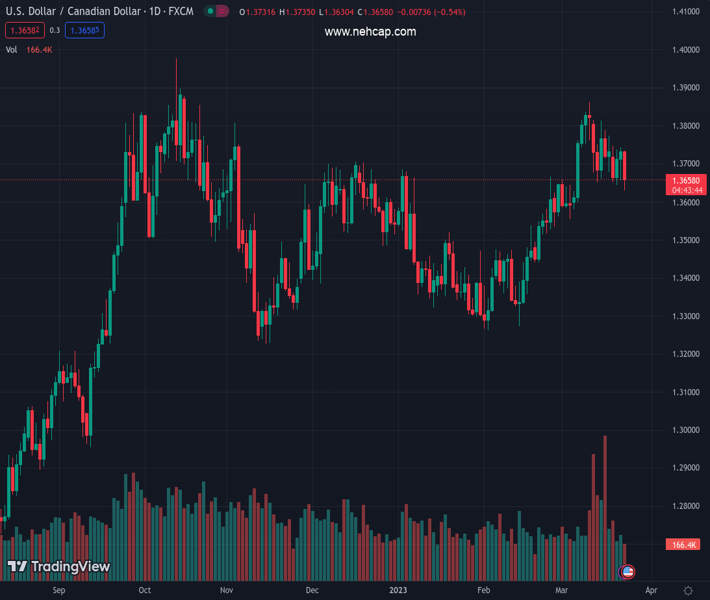
#USDCAD @ 1.36584 creeps lower below the 1.3700 figure on sentiment improvement and falling UST bond yields. (Pivot Orderbook analysis)
…
This is a premium post.
[s2If !current_user_can(access_s2member_level4)]Please register for PREMIUM VERSION HERE to read full post below containing analysis. In case of any error or you think you are not able to read the full post below, please email us at support#nehcap.com [lwa][/s2If] [s2If current_user_can(access_s2member_level4)]
- USD/CAD creeps lower below the 1.3700 figure on sentiment improvement and falling UST bond yields.
- US jobs data continues to justify further tightening by the Federal Reserve.
- USD/CAD Price Analysis: Once it falls below 1.3600, the 100-DMA is eyed.
The pair currently trades last at 1.36584.
The previous day high was 1.3745 while the previous day low was 1.3657. The daily 38.2% Fib levels comes at 1.3711, expected to provide resistance. Similarly, the daily 61.8% fib level is at 1.369, expected to provide resistance.
USD/CAD sellers moved in on Thursday after being kept at the sidelines on a risk-on impulse. Although the US Federal Reserve (Fed) raised rates as expected, market participants perceived Powell and Co.’s move as dovish. That said, the USD/CAD has fallen 0.56% or 76 pips, exchanging hands at 1.3654.
Wall Street remains bolstered by an upbeat mood. Investors had digested words from Janet Yellen, the US Treasury Secretary, who said that the United States (US) government is not planning to introduce blanket insurance to all depositors. However, a dovish rate hike by the Fed improved risk appetite.
Data-wise, the US economic docket featured Initial Jobless Claims for the week ending on March 18, which fell by 1,000, to 191,000 below estimates of 201,000. That reinforced the Fed’s view of a tight labor market and warranted further action by the US central bank. At the same time, the Chicago Fed National Activity Index for February plunged to -0.19 vs. the prior’s month 0.23
In the meantime, the US Dollar Index, a gauge of the buck’s value against a basket of six currencies, continues to stumble and is down 0.31% at 102.213, undermined by falling US Treasury bond yields.
Therefore, the Canadian Dollar (CAD) is being boosted by a softer US Dollar and high oil price, with Western Texas Intermediate (WTI) rising above the $70.00 a barrel threshold, for the first time since March 15. Therefore, the USD/CAD is set to continue to fall as the US Dollar continues to weaken.
After sliding below the 1.3700 figure, the USD/CAD is extending its losses past the 20-day Exponential Moving Average (EMA) at 1.3668. Additionally, the pair is trading at two-week new lows, with sellers eyeing a test of the March 3 low at 1.3550. But firstly, the USD/CAD needs to conquer the 1.3600 figure. A breach of the latter will expose the 50-day EMA at 1.3584 before testing 1.3550, ahead of dropping to the 100-day EMA at 1.3509.
Technical Levels: Supports and Resistances
USDCAD currently trading at 1.3658 at the time of writing. Pair opened at 1.3732 and is trading with a change of -0.54 % .
| Overview | Overview.1 | |
|---|---|---|
| 0 | Today last price | 1.3658 |
| 1 | Today Daily Change | -0.0074 |
| 2 | Today Daily Change % | -0.5400 |
| 3 | Today daily open | 1.3732 |
The pair is trading below its 20 Daily moving average @ 1.3686, above its 50 Daily moving average @ 1.3515 , above its 100 Daily moving average @ 1.3511 and above its 200 Daily moving average @ 1.3352
| Trends | Trends.1 | |
|---|---|---|
| 0 | Daily SMA20 | 1.3686 |
| 1 | Daily SMA50 | 1.3515 |
| 2 | Daily SMA100 | 1.3511 |
| 3 | Daily SMA200 | 1.3352 |
The previous day high was 1.3745 while the previous day low was 1.3657. The daily 38.2% Fib levels comes at 1.3711, expected to provide resistance. Similarly, the daily 61.8% fib level is at 1.369, expected to provide resistance.
Note the levels of interest below:
- Pivot support is noted at 1.3678, 1.3623, 1.359
- Pivot resistance is noted at 1.3765, 1.3799, 1.3853
| Levels | Levels.1 |
|---|---|
| Previous Daily High | 1.3745 |
| Previous Daily Low | 1.3657 |
| Previous Weekly High | 1.3828 |
| Previous Weekly Low | 1.3652 |
| Previous Monthly High | 1.3666 |
| Previous Monthly Low | 1.3262 |
| Daily Fibonacci 38.2% | 1.3711 |
| Daily Fibonacci 61.8% | 1.3690 |
| Daily Pivot Point S1 | 1.3678 |
| Daily Pivot Point S2 | 1.3623 |
| Daily Pivot Point S3 | 1.3590 |
| Daily Pivot Point R1 | 1.3765 |
| Daily Pivot Point R2 | 1.3799 |
| Daily Pivot Point R3 | 1.3853 |
[/s2If]
Join Our Telegram Group
")


