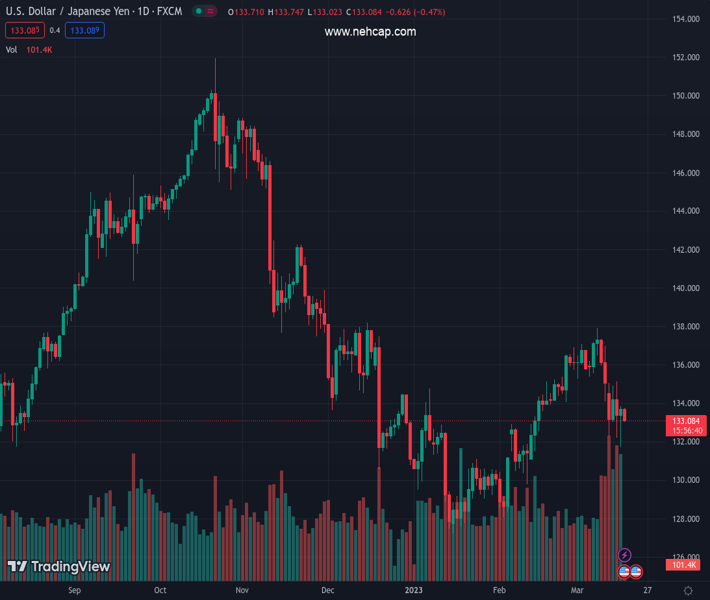
#USDJPY @ 133.100 in search for direction bias amid steady US Treasury yield. (Pivot Orderbook analysis)
…
This is a premium post.
[s2If !current_user_can(access_s2member_level4)]Please register for PREMIUM VERSION HERE to read full post below containing analysis. In case of any error or you think you are not able to read the full post below, please email us at support#nehcap.com [lwa][/s2If] [s2If current_user_can(access_s2member_level4)]
- USD/JPY in search for direction bias amid steady US Treasury yield.
- ECB rate hike impacts global yield complexes; central banks hold steady amid liquidity crunch.
- Fed’s March FOMC meeting unlikely to see pivotal shift in rate hiking cycle.
The pair currently trades last at 133.100.
The previous day high was 133.82 while the previous day low was 131.72. The daily 38.2% Fib levels comes at 133.02, expected to provide support. Similarly, the daily 61.8% fib level is at 132.52, expected to provide support.
USD/JPY price is heading down, looking to test the 130.00 mark on the back of softer US Treasury (UST) yields. Although the soft footing of the US Dollar across the board is not indicating anything significant yet, USD/JPY bounced on Thursday due to stabilization in UST yields. The risk aversion environment earlier in the week, led by a liquidity crunch among banks, prompted UST to fall.
The falling UST yields could be attributed to a recalibration of the Federal Reserve (Fed) rate hike expectations for March. That being said, the liquidity-drained incident from Silicon Valley Bank (SVB) to Credit Suisse has triggered a fresh wave of pessimism for the Fed’s March FOMC meeting.
The thought process was simple: the Fed should not deliver a jumbo rate hike at the March FOMC meeting amid a cluttering banking ecosystem. Therefore, the aforementioned expectation was factored into the yield price actions. As a result, the UST yields-sensitive USD/JPY started to fall.
Meanwhile, along with the Fed, investors were also dialing back rate hike expectations for other central banks like the European Central Bank (ECB). Contrary to this, the ECB delivered a pre-committed 50 bps rate hike on Thursday.
Sentiment took a U-turn this week when some key central banks intervened in the liquidity crises with backstop plans and prompted the ECB to maintain their rate-hiking plan. After the ECB event, global yield complexes rose on Thursday. And It seems like central banks are not keen to budge on this ongoing liquidity issue until it gets worse, and they will most likely remain on their hiking path.
An earlier comment from US Treasury Secretary Yellen said that government refunds of uninsured deposits will not be extended to every bank that fails and the Fitch rating agency said “our base case is that recent developments in the US will not cause major shifts in US monetary policy”.
Therefore, any pivotal shift seems premature for now. It might be the case that the Fed will deliver a 25 bps hike at the March FOMC meeting, but any major shift in the rate-hiking cycle is highly unlikely.
Technical Levels: Supports and Resistances
USDJPY currently trading at 133.27 at the time of writing. Pair opened at 133.73 and is trading with a change of -0.34 % .
| Overview | Overview.1 | |
|---|---|---|
| 0 | Today last price | 133.27 |
| 1 | Today Daily Change | -0.46 |
| 2 | Today Daily Change % | -0.34 |
| 3 | Today daily open | 133.73 |
The pair is trading below its 20 Daily moving average @ 135.32, above its 50 Daily moving average @ 132.54 , below its 100 Daily moving average @ 135.43 and below its 200 Daily moving average @ 137.49
| Trends | Trends.1 | |
|---|---|---|
| 0 | Daily SMA20 | 135.32 |
| 1 | Daily SMA50 | 132.54 |
| 2 | Daily SMA100 | 135.43 |
| 3 | Daily SMA200 | 137.49 |
The previous day high was 133.82 while the previous day low was 131.72. The daily 38.2% Fib levels comes at 133.02, expected to provide support. Similarly, the daily 61.8% fib level is at 132.52, expected to provide support.
Note the levels of interest below:
- Pivot support is noted at 132.36, 130.98, 130.25
- Pivot resistance is noted at 134.46, 135.2, 136.57
| Levels | Levels.1 |
|---|---|
| Previous Daily High | 133.82 |
| Previous Daily Low | 131.72 |
| Previous Weekly High | 137.91 |
| Previous Weekly Low | 134.12 |
| Previous Monthly High | 136.92 |
| Previous Monthly Low | 128.08 |
| Daily Fibonacci 38.2% | 133.02 |
| Daily Fibonacci 61.8% | 132.52 |
| Daily Pivot Point S1 | 132.36 |
| Daily Pivot Point S2 | 130.98 |
| Daily Pivot Point S3 | 130.25 |
| Daily Pivot Point R1 | 134.46 |
| Daily Pivot Point R2 | 135.20 |
| Daily Pivot Point R3 | 136.57 |
[/s2If]
Join Our Telegram Group
")


