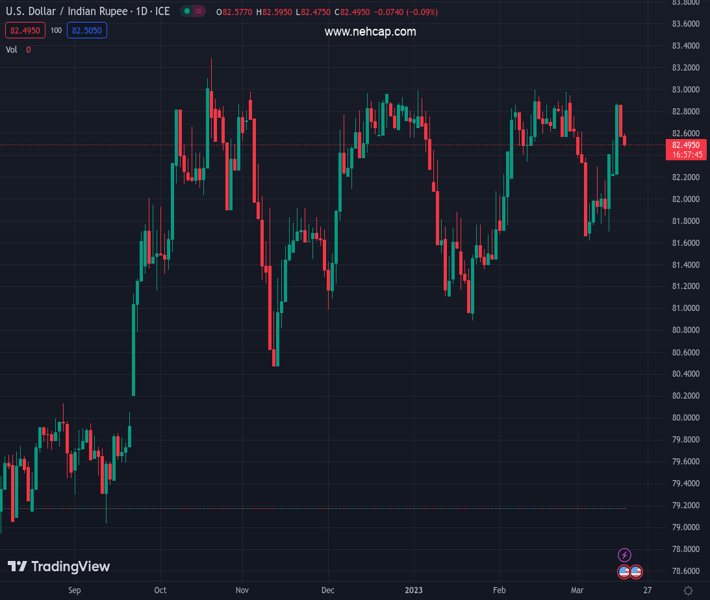
#USDINR @ 82.5010 extends the previous day’s pullback from three-week high. (Pivot Orderbook analysis)
…
This is a premium post.
[s2If !current_user_can(access_s2member_level4)]Please register for PREMIUM VERSION HERE to read full post below containing analysis. In case of any error or you think you are not able to read the full post below, please email us at support#nehcap.com [lwa][/s2If] [s2If current_user_can(access_s2member_level4)]
- USD/INR extends the previous day’s pullback from three-week high.
- US Treasury bond yields weigh on greenback amid receding fears of financial crisis.
- Mixed sentiment, light calendar and pre-Fed anxiety are extra catalysts that allow Indian Rupee to lick its wounds.
The pair currently trades last at 82.5010.
The previous day high was 83.0055 while the previous day low was 82.4442. The daily 38.2% Fib levels comes at 82.6586, expected to provide resistance. Similarly, the daily 61.8% fib level is at 82.7911, expected to provide resistance.
USD/INR holds lower grounds near 82.50 while keeping the previous day’s U-turn from a three-week low during early Friday. Even so, the Indian Rupee (INR) pair remains firmer for the second consecutive week heading into the next Wednesday’s Federal Open Market Committee (FOMC) monetary policy meeting.
The pair’s latest losses could be linked to the market’s cautious optimism as global policymakers and bankers try hard to avoid the return of 2008’s financial crisis. Additionally weighing on the USD/INR price could be the statements from the global rating giant Fitch that ruled out fears of US and European banking fallouts on the Asia-Pacific (APAC) banks.
Elsewhere, mixed US data raised doubts about the Federal Reserve’s (Fed) future rate hikes, even if the 25 basis points (bps) of an interest rate increase is almost given, which in turn allows the USD/INR to pare recent gains. Furthermore, the easing in Oil prices, despite the latest rebound, also favors the INR due to India’s reliance on energy imports and heavy current account deficit.
Alternatively, the recent downside inflation clues from India and the equity market rout challenge the pair sellers amid broad-based US Dollar buying. Additionally, traders appear less convinced by the latest efforts to defend the global banking sector as the measures appear restrictive. Also, the key central banks turned down the expectations of easy rate hikes and have allegedly blocked information on the causes behind the latest baking rout, which in turn keeps USD/INR bulls hopeful.
Amid these plays, the S&P 500 Futures pick up bids to pare the intraday losses around 3,995, following an upbeat close of the Wall Street benchmarks, whereas the US Treasury bond yields fade the previous day’s corrective bounce off the monthly low.
Looking forward, preliminary readings of the US Michigan Consumer Sentiment Index for March and the UoM 5-year Consumer Inflation Expectations for the said month will also be important for clear directions ahead of the next week’s Fed meeting.
A failure to cross the five-week-old descending resistance line, around 82.85 by the press time, directs USD/INR bears toward a convergence of the 100 and 50 DMAs, near 82.10.
Technical Levels: Supports and Resistances
USDINR currently trading at 82.4875 at the time of writing. Pair opened at 82.6091 and is trading with a change of -0.15% % .
| Overview | Overview.1 | |
|---|---|---|
| 0 | Today last price | 82.4875 |
| 1 | Today Daily Change | -0.1216 |
| 2 | Today Daily Change % | -0.15% |
| 3 | Today daily open | 82.6091 |
The pair remains strongly bullish on the daily timeframe. It trades above its 20 SMA @ 82.4265, 50 SMA 82.1329, 100 SMA @ 82.1281 and 200 SMA @ 81.0833.
| Trends | Trends.1 | |
|---|---|---|
| 0 | Daily SMA20 | 82.4265 |
| 1 | Daily SMA50 | 82.1329 |
| 2 | Daily SMA100 | 82.1281 |
| 3 | Daily SMA200 | 81.0833 |
The previous day high was 83.0055 while the previous day low was 82.4442. The daily 38.2% Fib levels comes at 82.6586, expected to provide resistance. Similarly, the daily 61.8% fib level is at 82.7911, expected to provide resistance.
Note the levels of interest below:
- Pivot support is noted at 82.367, 82.125, 81.8057
- Pivot resistance is noted at 82.9283, 83.2476, 83.4896
| Levels | Levels.1 |
|---|---|
| Previous Daily High | 83.0055 |
| Previous Daily Low | 82.4442 |
| Previous Weekly High | 82.3126 |
| Previous Weekly Low | 81.6120 |
| Previous Monthly High | 83.0820 |
| Previous Monthly Low | 81.5032 |
| Daily Fibonacci 38.2% | 82.6586 |
| Daily Fibonacci 61.8% | 82.7911 |
| Daily Pivot Point S1 | 82.3670 |
| Daily Pivot Point S2 | 82.1250 |
| Daily Pivot Point S3 | 81.8057 |
| Daily Pivot Point R1 | 82.9283 |
| Daily Pivot Point R2 | 83.2476 |
| Daily Pivot Point R3 | 83.4896 |
[/s2If]
Join Our Telegram Group
")


