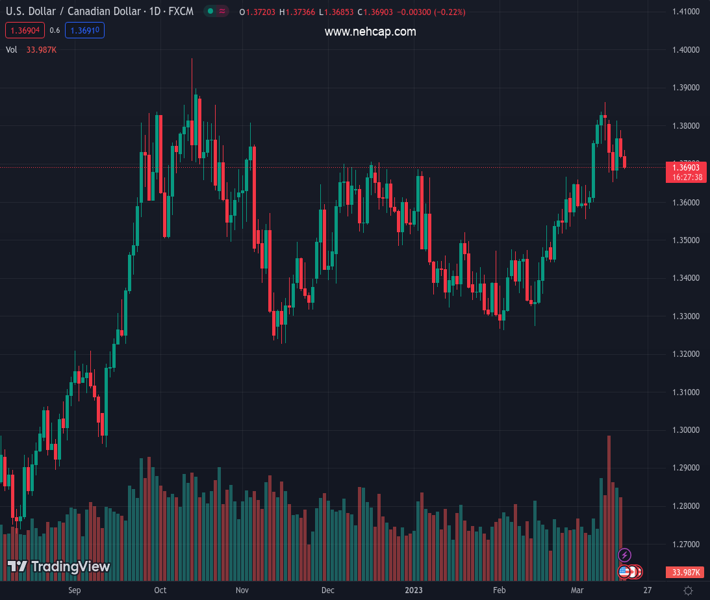
#USDCAD @ 1.36915 has slipped further below 1.3700 amid an extended correction in the USD Index. (Pivot Orderbook analysis)
…
This is a premium post.
[s2If !current_user_can(access_s2member_level4)]Please register for PREMIUM VERSION HERE to read full post below containing analysis. In case of any error or you think you are not able to read the full post below, please email us at support#nehcap.com [lwa][/s2If] [s2If current_user_can(access_s2member_level4)]
- USD/CAD has slipped further below 1.3700 amid an extended correction in the USD Index.
- Oil price has scaled above $69.00 amid the revised 2023 China GDP forecast to 6.0% from 5.5% previously estimated.
- Going forward, Canada’s Inflation data will be of utmost importance.
The pair currently trades last at 1.36915.
The previous day high was 1.3788 while the previous day low was 1.3714. The daily 38.2% Fib levels comes at 1.3742, expected to provide resistance. Similarly, the daily 61.8% fib level is at 1.376, expected to provide resistance.
The USD/CAD pair has slipped below the round-level support of 1.3700 in the Asian session. The Loonie asset is following the footprints of the US Dollar Index (DXY) and has witnessed selling pressure. The downside move in the major is also backed by an extension in the oil price on the upside.
S&P500 futures have recovered nominal losses generated in the early Asian session, portraying further improvement in the risk appetite of the market participants. The US Dollar Index (DXY) has slipped below the crucial support of 104.20 and is expected to remain on the tenterhooks as the Federal Reserve (Fed) is expected to sound less hawkish in its monetary policy meeting next week.
Meanwhile, US government bonds are showing confusing performance amid a lack of clarity over the Fed’s monetary policy outlook. The 10-year US Treasury yields are hovering around 3.57%.
Going forward, the Canadian Dollar is likely to dance to the tunes of Canada’s inflation data, which will release on Tuesday. As per the consensus, the headline Consumer Price Index (CPI) is expected to accelerate by 0.4%, lower than the former release of 0.5%. This might drag the annual headline CPI further to 5.5%. Also, the annual core CPI is expected to trim to 4.6% from the former release of 5.0%.
It seems that Canadian inflation is declining according to the roadmap designed by the Bank of Canada (BoC) to bring down stubborn inflation and achieve price stability.
Investors should be aware of the fact that BoC Governor Tiff Macklem has already held interest rates steady at 4.5%. BoC Macklem considers the current monetary policy as restrictive enough to scale down price pressures.
On the oil front, oil price has extended its recovery above $69.00 as investment banking firm, Goldman Sachs, has revised 2023 China’s GDP projections to 6% from 5.5% anticipated earlier. It is worth noting that Canada is a leading exporter of oil to the United States and higher oil prices would support the Canadian Dollar.
Technical Levels: Supports and Resistances
USDCAD currently trading at 1.3693 at the time of writing. Pair opened at 1.3722 and is trading with a change of -0.21 % .
| Overview | Overview.1 | |
|---|---|---|
| 0 | Today last price | 1.3693 |
| 1 | Today Daily Change | -0.0029 |
| 2 | Today Daily Change % | -0.2100 |
| 3 | Today daily open | 1.3722 |
The pair remains strongly bullish on the daily timeframe. It trades above its 20 SMA @ 1.3645, 50 SMA 1.3492, 100 SMA @ 1.3508 and 200 SMA @ 1.3335.
| Trends | Trends.1 | |
|---|---|---|
| 0 | Daily SMA20 | 1.3645 |
| 1 | Daily SMA50 | 1.3492 |
| 2 | Daily SMA100 | 1.3508 |
| 3 | Daily SMA200 | 1.3335 |
The previous day high was 1.3788 while the previous day low was 1.3714. The daily 38.2% Fib levels comes at 1.3742, expected to provide resistance. Similarly, the daily 61.8% fib level is at 1.376, expected to provide resistance.
Note the levels of interest below:
- Pivot support is noted at 1.3694, 1.3667, 1.362
- Pivot resistance is noted at 1.3769, 1.3815, 1.3843
| Levels | Levels.1 |
|---|---|
| Previous Daily High | 1.3788 |
| Previous Daily Low | 1.3714 |
| Previous Weekly High | 1.3862 |
| Previous Weekly Low | 1.3582 |
| Previous Monthly High | 1.3666 |
| Previous Monthly Low | 1.3262 |
| Daily Fibonacci 38.2% | 1.3742 |
| Daily Fibonacci 61.8% | 1.3760 |
| Daily Pivot Point S1 | 1.3694 |
| Daily Pivot Point S2 | 1.3667 |
| Daily Pivot Point S3 | 1.3620 |
| Daily Pivot Point R1 | 1.3769 |
| Daily Pivot Point R2 | 1.3815 |
| Daily Pivot Point R3 | 1.3843 |
[/s2If]
Join Our Telegram Group
")


