#USDMXN @ 18.7407 reverses from 100-HMA hurdle to pare intraday gains., @nehcap view: Further downside expected (Pivot Orderbook analysis)
…
This is a premium post.
[s2If !current_user_can(access_s2member_level4)]Please register for PREMIUM VERSION HERE to read full post below containing analysis. In case of any error or you think you are not able to read the full post below, please email us at support#nehcap.com [lwa][/s2If] [s2If current_user_can(access_s2member_level4)]
- USD/MXN reverses from 100-HMA hurdle to pare intraday gains.
- Bearish chart formation needs confirmation from 18.55, downbeat oscillators keep sellers hopeful.
- 200-HMA acts as additional downside filter, bulls need validation from February’s top to tighten the grips.
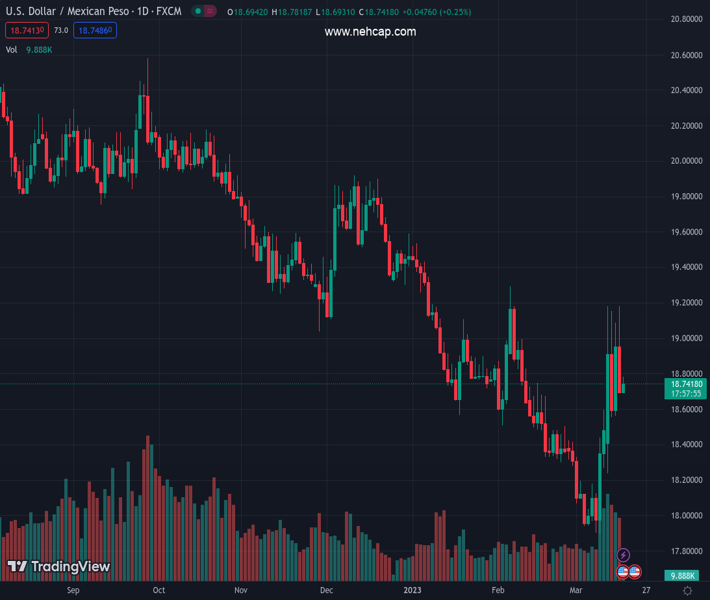
The pair currently trades last at 18.7407.
The previous day high was 19.1799 while the previous day low was 18.6976. The daily 38.2% Fib levels comes at 18.8818, expected to provide resistance. Similarly, the daily 61.8% fib level is at 18.9956, expected to provide resistance.
USD/MXN bears remain hopeful as the Mexican Peso (MXN) pair take a U-turn from the 100-Hour Moving Average (HMA) to pare intraday gains around 18.75 during early Friday.
Not only the failure to cross the 100-HMA but bearish MACD signals and downbeat RSI (14), not oversold, also favor the USD/MXN sellers.
Above all, the pair’s “double top” bearish chart pattern, by reversing twice from the 19.20 hurdle, keeps the USD/MXN sellers hopeful.
However, a clear downside break of the stated pattern’s lower end, around 18.55, becomes necessary for the bears to retake control.
Following that, the 200-HMA level of 18.45 may act as a buffer during the theoretical fall targeting the monthly low surrounding 17.90, also the lowest level since 2017.
Meanwhile, recovery moves, need to cross the 100-HMA hurdle of 18.80 to convince intraday buyers.
Even so, the previous support line from March 09, close to 18.93 at the latest, could challenge the USD/MXN pair’s run-up towards the double tops marked around 19.20.
In a case where USD/MXN crosses the 19.20 hurdle, February’s peak of 19.29 and the 20.00 psychological manget appear as the key upside levels to watch for buyers.
Trend: Further downside expected
Technical Levels: Supports and Resistances
USDMXN currently trading at 18.739 at the time of writing. Pair opened at 18.714 and is trading with a change of 0.13% % .
| Overview | Overview.1 | |
|---|---|---|
| 0 | Today last price | 18.739 |
| 1 | Today Daily Change | 0.0250 |
| 2 | Today Daily Change % | 0.13% |
| 3 | Today daily open | 18.714 |
The pair is trading above its 20 Daily moving average @ 18.3675, above its 50 Daily moving average @ 18.6383 , below its 100 Daily moving average @ 19.0792 and below its 200 Daily moving average @ 19.63
| Trends | Trends.1 | |
|---|---|---|
| 0 | Daily SMA20 | 18.3675 |
| 1 | Daily SMA50 | 18.6383 |
| 2 | Daily SMA100 | 19.0792 |
| 3 | Daily SMA200 | 19.6300 |
The previous day high was 19.1799 while the previous day low was 18.6976. The daily 38.2% Fib levels comes at 18.8818, expected to provide resistance. Similarly, the daily 61.8% fib level is at 18.9956, expected to provide resistance.
Note the levels of interest below:
- Pivot support is noted at 18.5478, 18.3816, 18.0656
- Pivot resistance is noted at 19.0301, 19.3461, 19.5123
| Levels | Levels.1 |
|---|---|
| Previous Daily High | 19.1799 |
| Previous Daily Low | 18.6976 |
| Previous Weekly High | 18.5957 |
| Previous Weekly Low | 17.8977 |
| Previous Monthly High | 19.2901 |
| Previous Monthly Low | 18.2954 |
| Daily Fibonacci 38.2% | 18.8818 |
| Daily Fibonacci 61.8% | 18.9956 |
| Daily Pivot Point S1 | 18.5478 |
| Daily Pivot Point S2 | 18.3816 |
| Daily Pivot Point S3 | 18.0656 |
| Daily Pivot Point R1 | 19.0301 |
| Daily Pivot Point R2 | 19.3461 |
| Daily Pivot Point R3 | 19.5123 |
[/s2If]
Join Our Telegram Group
")


