#EURUSD @ 1.06181 struggles to extend the previous day’s corrective bounce during the first downbeat week in three., @nehcap view: Further downside expected (Pivot Orderbook analysis)
…
This is a premium post.
[s2If !current_user_can(access_s2member_level4)]Please register for PREMIUM VERSION HERE to read full post below containing analysis. In case of any error or you think you are not able to read the full post below, please email us at support#nehcap.com [lwa][/s2If] [s2If current_user_can(access_s2member_level4)]
- EUR/USD struggles to extend the previous day’s corrective bounce during the first downbeat week in three.
- Three-week-old descending support line repeatedly challenges bears even if the key SMAs probe upside momentum.
- Bearish MACD signals, one-month-old descending resistance line add to the upside filters.
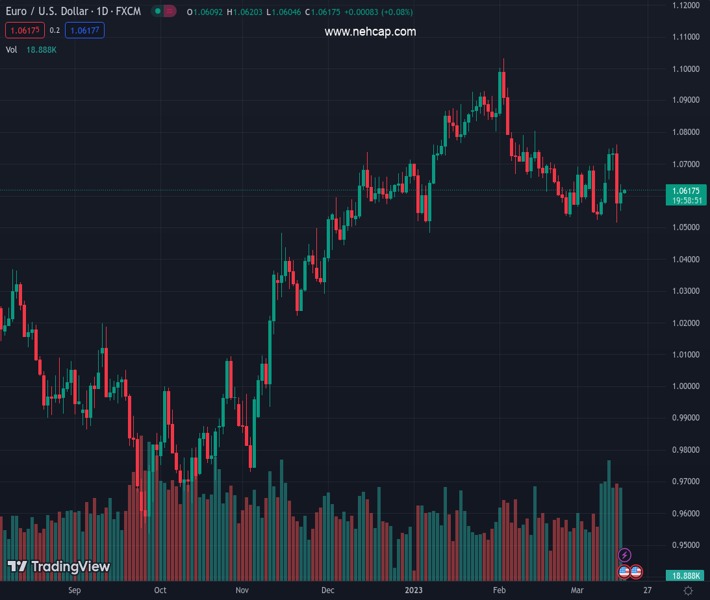
The pair currently trades last at 1.06181.
The previous day high was 1.0636 while the previous day low was 1.0551. The daily 38.2% Fib levels comes at 1.0603, expected to provide support. Similarly, the daily 61.8% fib level is at 1.0583, expected to provide support.
EUR/USD stays defensive around 1.0610-15 as bulls and bears jostle near the end of a volatile week, eyeing the first weekly loss in three despite the previous day’s bounce off a 10-week low.
In doing so, the Euro pair struggles to extend the U-turn from a three-week-long support line, around 1.0515 by the press time, as the 50-bar Simple Moving Average (SMA) joins the bearish MACD signals to challenge the bulls.
With this, the major currency pair is all set to retest the aforementioned support line of near 1.0515. However, the 1.0600 threshold and multiple supports around the 1.0580-75 zone could test the EUR/USD bears.
In a case where the pair sellers break the previously stated key support of 1.0515, the 1.0500 round may act as a validation point for the south-run targeting the four-month-old horizontal support comprising the Year-To-Date low and November 2022 high surrounding 1.0485-80.
Alternatively, an upside break of the 50-SMA, around 1.0630 by the press time, may help the EUR/USD buyers to aim for the 200-SMA hurdle surrounding 1.0680.
However, a downward-sloping resistance line from mid-February, near 1.0755 by the press time, could challenge the bulls afterward.
To sum up, EUR/USD is likely to remain pressured even if the downside room appears limited.
Trend: Further downside expected
Technical Levels: Supports and Resistances
EURUSD currently trading at 1.0615 at the time of writing. Pair opened at 1.061 and is trading with a change of 0.05% % .
| Overview | Overview.1 | |
|---|---|---|
| 0 | Today last price | 1.0615 |
| 1 | Today Daily Change | 0.0005 |
| 2 | Today Daily Change % | 0.05% |
| 3 | Today daily open | 1.061 |
The pair is trading below its 20 Daily moving average @ 1.0625, below its 50 Daily moving average @ 1.0728 , above its 100 Daily moving average @ 1.0562 and above its 200 Daily moving average @ 1.0325
| Trends | Trends.1 | |
|---|---|---|
| 0 | Daily SMA20 | 1.0625 |
| 1 | Daily SMA50 | 1.0728 |
| 2 | Daily SMA100 | 1.0562 |
| 3 | Daily SMA200 | 1.0325 |
The previous day high was 1.0636 while the previous day low was 1.0551. The daily 38.2% Fib levels comes at 1.0603, expected to provide support. Similarly, the daily 61.8% fib level is at 1.0583, expected to provide support.
Note the levels of interest below:
- Pivot support is noted at 1.0562, 1.0514, 1.0477
- Pivot resistance is noted at 1.0647, 1.0684, 1.0731
| Levels | Levels.1 |
|---|---|
| Previous Daily High | 1.0636 |
| Previous Daily Low | 1.0551 |
| Previous Weekly High | 1.0701 |
| Previous Weekly Low | 1.0524 |
| Previous Monthly High | 1.1033 |
| Previous Monthly Low | 1.0533 |
| Daily Fibonacci 38.2% | 1.0603 |
| Daily Fibonacci 61.8% | 1.0583 |
| Daily Pivot Point S1 | 1.0562 |
| Daily Pivot Point S2 | 1.0514 |
| Daily Pivot Point S3 | 1.0477 |
| Daily Pivot Point R1 | 1.0647 |
| Daily Pivot Point R2 | 1.0684 |
| Daily Pivot Point R3 | 1.0731 |
[/s2If]
Join Our Telegram Group
")


