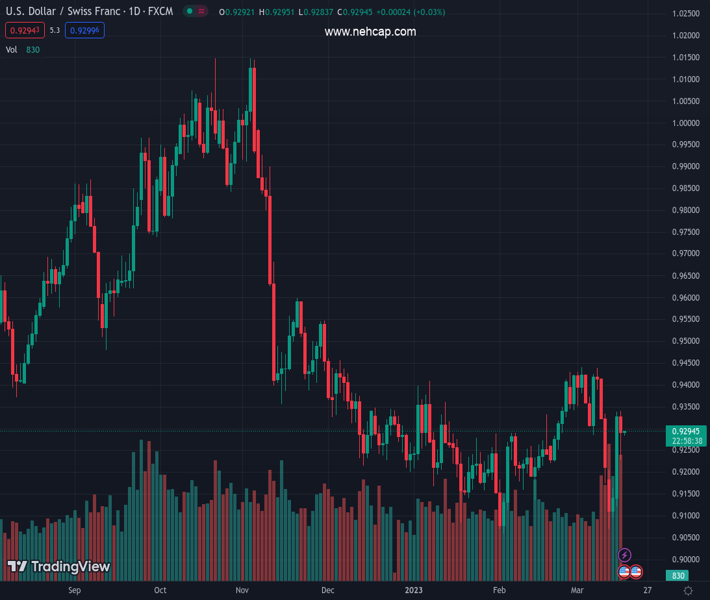
#USDCHF @ 0.92910 hovers slightly below the 0.9300 figure and remains around the 20-day EMA. (Pivot Orderbook analysis)
…
This is a premium post.
[s2If !current_user_can(access_s2member_level4)]Please register for PREMIUM VERSION HERE to read full post below containing analysis. In case of any error or you think you are not able to read the full post below, please email us at support#nehcap.com [lwa][/s2If] [s2If current_user_can(access_s2member_level4)]
- USD/CHF hovers slightly below the 0.9300 figure and remains around the 20-day EMA.
- USD/CHF Price Analysis: Upward biased in the near term, but downside risks remain on a break below the 20-day EMA.
The pair currently trades last at 0.92910.
The previous day high was 0.9338 while the previous day low was 0.9123. The daily 38.2% Fib levels comes at 0.9256, expected to provide support. Similarly, the daily 61.8% fib level is at 0.9205, expected to provide support.
USD/CHF retreats from weekly highs of 0.9340 and meanders between two daily Exponential Moving Averages (EMAs), at around 0.9290s. An improvement in market sentiment, and a soft US Dollar (USD), triggered flows toward the Swiss Franc (CHF), which recovered some ground.
Following Wednesday’s price action that saw the USD/CHF pair gaining 2%, Thursday’s session turned red. Nevertheless, the USD/CHF stayed nearby the 20/50-day EMAs, each at 0.9288 and 0.9297, respectively. If the USD/CHF cracks the top of the range, that will poise the pair towards 0.9300 and beyond. Once the figure is conquered, the USD/CHF will test the 100-day EMA at 0.9366, followed by the 0.9400 mark. A rally above will lift the USD/CHF toward the 200-day EMA at 0.9435.
In an alternate scenario, the USD/CHF first support will be the 20-day EMA At 0.9288. a breach of the latter and the USD/CHF will dive towards March 16 low at 0.9229 before stumbling to 0.9200.
Technical Levels: Supports and Resistances
USDCHF currently trading at 0.9297 at the time of writing. Pair opened at 0.9331 and is trading with a change of -0.36 % .
| Overview | Overview.1 | |
|---|---|---|
| 0 | Today last price | 0.9297 |
| 1 | Today Daily Change | -0.0034 |
| 2 | Today Daily Change % | -0.3600 |
| 3 | Today daily open | 0.9331 |
The pair is trading below its 20 Daily moving average @ 0.9316, above its 50 Daily moving average @ 0.926 , below its 100 Daily moving average @ 0.938 and below its 200 Daily moving average @ 0.9553
| Trends | Trends.1 | |
|---|---|---|
| 0 | Daily SMA20 | 0.9316 |
| 1 | Daily SMA50 | 0.9260 |
| 2 | Daily SMA100 | 0.9380 |
| 3 | Daily SMA200 | 0.9553 |
The previous day high was 0.9338 while the previous day low was 0.9123. The daily 38.2% Fib levels comes at 0.9256, expected to provide support. Similarly, the daily 61.8% fib level is at 0.9205, expected to provide support.
Note the levels of interest below:
- Pivot support is noted at 0.919, 0.905, 0.8976
- Pivot resistance is noted at 0.9405, 0.9479, 0.962
| Levels | Levels.1 |
|---|---|
| Previous Daily High | 0.9338 |
| Previous Daily Low | 0.9123 |
| Previous Weekly High | 0.9439 |
| Previous Weekly Low | 0.9175 |
| Previous Monthly High | 0.9429 |
| Previous Monthly Low | 0.9059 |
| Daily Fibonacci 38.2% | 0.9256 |
| Daily Fibonacci 61.8% | 0.9205 |
| Daily Pivot Point S1 | 0.9190 |
| Daily Pivot Point S2 | 0.9050 |
| Daily Pivot Point S3 | 0.8976 |
| Daily Pivot Point R1 | 0.9405 |
| Daily Pivot Point R2 | 0.9479 |
| Daily Pivot Point R3 | 0.9620 |
[/s2If]
Join Our Telegram Group
")


