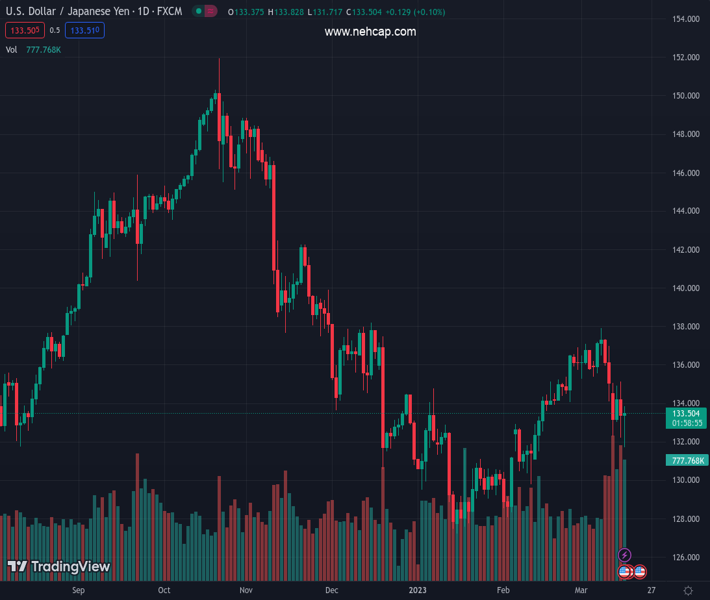
#USDJPY @ 133.548 is almost flat during the North American session. (Pivot Orderbook analysis)
…
This is a premium post.
[s2If !current_user_can(access_s2member_level4)]Please register for PREMIUM VERSION HERE to read full post below containing analysis. In case of any error or you think you are not able to read the full post below, please email us at support#nehcap.com [lwa][/s2If] [s2If current_user_can(access_s2member_level4)]
- USD/JPY is almost flat during the North American session.
- Oscillators remain in bearish territory, but price action signals consolidation.
- USD/JPY Price Analysis: Sellers reclaiming 132.21 would exacerbate a fall toward 127.20s.
The pair currently trades last at 133.548.
The previous day high was 135.12 while the previous day low was 132.22. The daily 38.2% Fib levels comes at 133.32, expected to provide support. Similarly, the daily 61.8% fib level is at 134.01, expected to provide resistance.
USD/JPY rises after dropping to a fresh four-week low at 131.71 but stages a comeback and has reclaimed the 133.00 figure. Nevertheless, a wall of resistance with all the daily Exponential Moving Averages (EMAs) above the exchange rate supports a bearish bias. Hence, the USD/JPY is trading at 133.56, above its opening price by a decent 0.14%.
The USD/JPY is neutral biased after the 20, 50, 100, and 200-day EMAs intersected at around the 134.05-92 area. However, oscillators like the Relative Strength Index (RSI) and the Rate of Change (RoC), suggest that sellers are in charge. But price action, as the leading indicator, needs sellers to reclaim the February 10 daily low at 129.79, which could open the door for further downside.
For a bearish continuation, the USD/JPY must fall below the March 15 low of 132.21. Once cleared, the 132.00 figure would be for grabs. Seller’s next stop would be the February 2 daily low at 128.08, followed by the YTD low at 127.21.
In an alternate scenario, the USD/JPY first resistance would be the 200-day EMA at 134.05. A breach of the latter would expose the 50 and 20-day EMAs, each at 134.13 and 134.59, ahead of testing the 100-day EMA at 134.92. Once broken, the buyers would reclaim 135.00.
Technical Levels: Supports and Resistances
USDJPY currently trading at 133.6 at the time of writing. Pair opened at 133.42 and is trading with a change of 0.13 % .
| Overview | Overview.1 | |
|---|---|---|
| 0 | Today last price | 133.60 |
| 1 | Today Daily Change | 0.18 |
| 2 | Today Daily Change % | 0.13 |
| 3 | Today daily open | 133.42 |
The pair is trading below its 20 Daily moving average @ 135.33, above its 50 Daily moving average @ 132.54 , below its 100 Daily moving average @ 135.56 and below its 200 Daily moving average @ 137.49
| Trends | Trends.1 | |
|---|---|---|
| 0 | Daily SMA20 | 135.33 |
| 1 | Daily SMA50 | 132.54 |
| 2 | Daily SMA100 | 135.56 |
| 3 | Daily SMA200 | 137.49 |
The previous day high was 135.12 while the previous day low was 132.22. The daily 38.2% Fib levels comes at 133.32, expected to provide support. Similarly, the daily 61.8% fib level is at 134.01, expected to provide resistance.
Note the levels of interest below:
- Pivot support is noted at 132.05, 130.68, 129.15
- Pivot resistance is noted at 134.95, 136.48, 137.85
| Levels | Levels.1 |
|---|---|
| Previous Daily High | 135.12 |
| Previous Daily Low | 132.22 |
| Previous Weekly High | 137.91 |
| Previous Weekly Low | 134.12 |
| Previous Monthly High | 136.92 |
| Previous Monthly Low | 128.08 |
| Daily Fibonacci 38.2% | 133.32 |
| Daily Fibonacci 61.8% | 134.01 |
| Daily Pivot Point S1 | 132.05 |
| Daily Pivot Point S2 | 130.68 |
| Daily Pivot Point S3 | 129.15 |
| Daily Pivot Point R1 | 134.95 |
| Daily Pivot Point R2 | 136.48 |
| Daily Pivot Point R3 | 137.85 |
[/s2If]
Join Our Telegram Group
")


