WTI is recovering from falling 5% on Wednesday due to a risk-off impulse. (Pivot Orderbook analysis)
…
This is a premium post.
[s2If !current_user_can(access_s2member_level4)]Please register for PREMIUM VERSION HERE to read full post below containing analysis. In case of any error or you think you are not able to read the full post below, please email us at support#nehcap.com [lwa][/s2If] [s2If current_user_can(access_s2member_level4)]
- WTI is recovering from falling 5% on Wednesday due to a risk-off impulse.
- OPEC: The week’s fall is blamed on sentiment shifting sour on turbulence in the financial market.
- The market sentiment improved on Swiss authorities supporting Credit Suisse.
The pair currently trades last at 69.17.
The previous day high was 72.69 while the previous day low was 65.81. The daily 38.2% Fib levels comes at 68.44, expected to provide support. Similarly, the daily 61.8% fib level is at 70.06, expected to provide resistance.
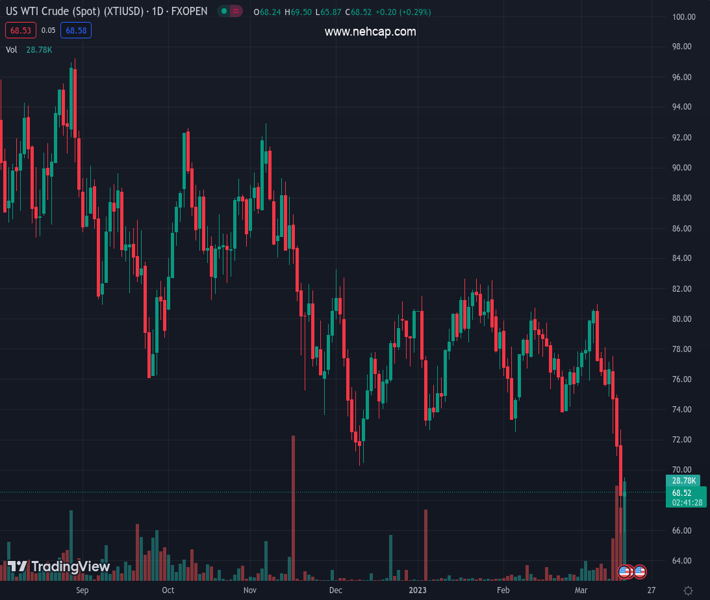
Western Texas Intermediate (WTI), the US crude oil benchmark, gains traction after dropping to a 15-month-low at around 65.72, sponsored by a risk-on impulse. The Wall Street Journal (WSJ) reported that major banks in the US are stepping in to help First Republic Bank, an action cheered by US equities and oil prices. WTI is trading at 68.25, above its opening price by 0.03%.
Additionally to the abovementioned factors, WTI is underpinned by reports that Saudi Arabia and Russia met to discuss enhancing market stability. Saudi’s energy minister Prince Abdulaziz bin Salman and Russian deputy prime minister Alexander Novak met in the Saudi capital to discuss the OPEC+ group’s efforts to maintain market balance.
Delegates from the Organization of Petroleum Exporting Countries (OPEC) and its allies told Reuters that “this week’s slide in oil prices to be driven by financial fears, not any imbalance between demand and supply, and expects the market to stabilize.”
WTI fell due to the turbulence in the financial markets. Swiss authorities backing up Credit Suisse (CS) and US Treasury Secretary Janet Yellen assuring lawmakers that the US banking system remained sound were a tailwind for WTI.
This week, OPEC and the International Energy Agency (IEA) have both predicted an increase in oil demand, but the market is still being affected by concerns about excess supply.
The IEA commented that stockpiles in developed countries hit an 18-month high, while Russian output stayed around familiar levels in February.
Technical Levels: Supports and Resistances
XTIUSD currently trading at 69.17 at the time of writing. Pair opened at 68.41 and is trading with a change of 1.11 % .
| Overview | Overview.1 | |
|---|---|---|
| 0 | Today last price | 69.17 |
| 1 | Today Daily Change | 0.76 |
| 2 | Today Daily Change % | 1.11 |
| 3 | Today daily open | 68.41 |
The pair remains strongly bearish on the daily time frame. It trades below the 20 SMA @ 76.24, 50 SMA 77.5, 100 SMA @ 79.0 and 200 SMA @ 86.09.
| Trends | Trends.1 | |
|---|---|---|
| 0 | Daily SMA20 | 76.24 |
| 1 | Daily SMA50 | 77.50 |
| 2 | Daily SMA100 | 79.00 |
| 3 | Daily SMA200 | 86.09 |
The previous day high was 72.69 while the previous day low was 65.81. The daily 38.2% Fib levels comes at 68.44, expected to provide support. Similarly, the daily 61.8% fib level is at 70.06, expected to provide resistance.
Note the levels of interest below:
- Pivot support is noted at 65.25, 62.09, 58.37
- Pivot resistance is noted at 72.13, 75.85, 79.01
| Levels | Levels.1 |
|---|---|
| Previous Daily High | 72.69 |
| Previous Daily Low | 65.81 |
| Previous Weekly High | 80.99 |
| Previous Weekly Low | 74.89 |
| Previous Monthly High | 80.75 |
| Previous Monthly Low | 72.50 |
| Daily Fibonacci 38.2% | 68.44 |
| Daily Fibonacci 61.8% | 70.06 |
| Daily Pivot Point S1 | 65.25 |
| Daily Pivot Point S2 | 62.09 |
| Daily Pivot Point S3 | 58.37 |
| Daily Pivot Point R1 | 72.13 |
| Daily Pivot Point R2 | 75.85 |
| Daily Pivot Point R3 | 79.01 |
[/s2If]
Join Our Telegram Group
")


