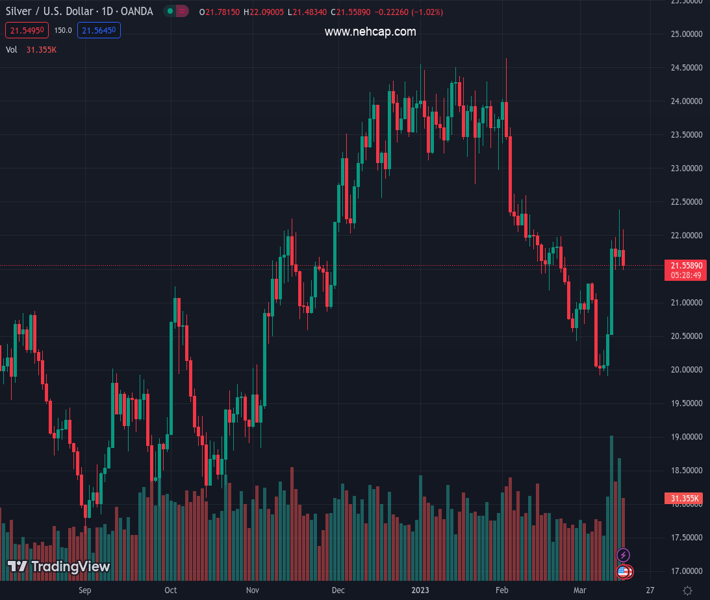
#XAGUSD @ 21.569 Silver price dropped sharply recently, following solid US jobs and housing data. (Pivot Orderbook analysis)
…
This is a premium post.
[s2If !current_user_can(access_s2member_level4)]Please register for PREMIUM VERSION HERE to read full post below containing analysis. In case of any error or you think you are not able to read the full post below, please email us at support#nehcap.com [lwa][/s2If] [s2If current_user_can(access_s2member_level4)]
- Silver price dropped sharply recently, following solid US jobs and housing data.
- The ECB surprised the markets with a 50 bps hike; the following meetings are live.
- XAG/USD Price Analysis: To remain downward biased, below $21.80.
The pair currently trades last at 21.569.
The previous day high was 22.39 while the previous day low was 21.54. The daily 38.2% Fib levels comes at 22.07, expected to provide resistance. Similarly, the daily 61.8% fib level is at 21.87, expected to provide resistance.
Silver price fluctuates between gains and losses after hitting a daily high of $22.08, erasing some of its earlier gains. The European Central Bank (ECB) surprised the markets with a 50 bps lift, amidst a turmoil period in the financial markets, with Credit Suisse (CS) at the brisk of defaulting. At the time of writing, the XAG/USD exchanges hands at $21.54.
Sentiment remains fragile, with most global equities dropping except the Nasdaq 100. The European Central Bank (ECB) raised rates by 50 basis points (bps) and stated that inflation remains too high. However, the statement did not provide forward guidance regarding future monetary policy decisions.
The US economic docket revealed that unemployment claims, reported by the US Bureau of Labor Statistics (BLS), eased below the 200K mark, a sign of the labor market tightness. Initial Jobless Claims rose by 192K vs. 205K, estimated by market participants. At the same time, housing data, led by Housing Starts and Building Permits, exceeded estimates, showing the economy’s resilience despite Fed’s aggressive tightening cycle.
The greenback remains under pressure, as shown by the US Dollar Index (DXY), down 0.26% at 104.478. US Treasury bond yields are recovering some ground, with 2s up 13 bps at 4.019%. On the contrary, the 10-year benchmark note rate is 3.432%, down two bps, a tailwind for XAG/USD.
The US economic calendar will feature Industrial Production, Capacity Utilization, and the University of Michigan (UoM) Consumer sentiment.
The XAG/USD reached for two straight days the $22.00 mark but failing to hold to gains showed sellers’ commitment to keeping the price below the figure. Why? Because after the two attempts, the XAG/USD dropped below the confluence of daily Exponential Moving Averages (EMAs), particularly the 200-day at $21.78. therefore the path of least resistance is downwards. The XAG/USD first support would be $21.50, followed by the 20-day EMA at $21.29, and then the figure at $21. Alternatively, a daily close above $22.00 could pave the way for further upside.
Technical Levels: Supports and Resistances
XAGUSD currently trading at 21.62 at the time of writing. Pair opened at 21.78 and is trading with a change of -0.73 % .
| Overview | Overview.1 | |
|---|---|---|
| 0 | Today last price | 21.62 |
| 1 | Today Daily Change | -0.16 |
| 2 | Today Daily Change % | -0.73 |
| 3 | Today daily open | 21.78 |
The pair is trading above its 20 Daily moving average @ 21.11, below its 50 Daily moving average @ 22.39 , below its 100 Daily moving average @ 22.27 and above its 200 Daily moving average @ 20.94
| Trends | Trends.1 | |
|---|---|---|
| 0 | Daily SMA20 | 21.11 |
| 1 | Daily SMA50 | 22.39 |
| 2 | Daily SMA100 | 22.27 |
| 3 | Daily SMA200 | 20.94 |
The previous day high was 22.39 while the previous day low was 21.54. The daily 38.2% Fib levels comes at 22.07, expected to provide resistance. Similarly, the daily 61.8% fib level is at 21.87, expected to provide resistance.
Note the levels of interest below:
- Pivot support is noted at 21.42, 21.06, 20.57
- Pivot resistance is noted at 22.26, 22.75, 23.11
| Levels | Levels.1 |
|---|---|
| Previous Daily High | 22.39 |
| Previous Daily Low | 21.54 |
| Previous Weekly High | 21.31 |
| Previous Weekly Low | 19.90 |
| Previous Monthly High | 24.64 |
| Previous Monthly Low | 20.42 |
| Daily Fibonacci 38.2% | 22.07 |
| Daily Fibonacci 61.8% | 21.87 |
| Daily Pivot Point S1 | 21.42 |
| Daily Pivot Point S2 | 21.06 |
| Daily Pivot Point S3 | 20.57 |
| Daily Pivot Point R1 | 22.26 |
| Daily Pivot Point R2 | 22.75 |
| Daily Pivot Point R3 | 23.11 |
[/s2If]
Join Our Telegram Group
")


