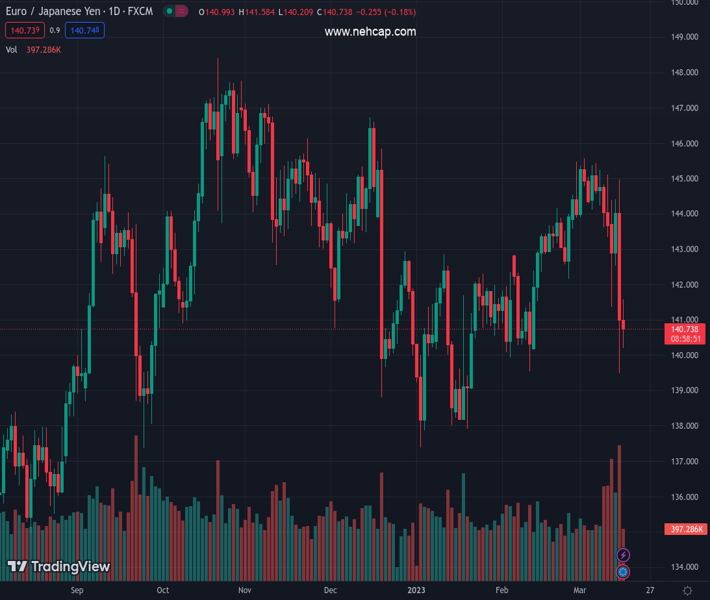
#EURJPY @ 140.733 adds to Wednesday’s acute drop below the 141.00 mark. (Pivot Orderbook analysis)
…
This is a premium post.
[s2If !current_user_can(access_s2member_level4)]Please register for PREMIUM VERSION HERE to read full post below containing analysis. In case of any error or you think you are not able to read the full post below, please email us at support#nehcap.com [lwa][/s2If] [s2If current_user_can(access_s2member_level4)]
- EUR/JPY adds to Wednesday’s acute drop below the 141.00 mark.
- Next on the downside comes the YTD low near 137.40.
The pair currently trades last at 140.733.
The previous day high was 144.96 while the previous day low was 139.48. The daily 38.2% Fib levels comes at 141.58, expected to provide resistance. Similarly, the daily 61.8% fib level is at 142.87, expected to provide resistance.
EUR/JPY remains on the defensive and returns to the sub-141.00 region after the earlier bull run to the 141.55/60 band on Thursday.
The sharp retracement could now motivate the cross to revisit the March low at 139.48 (March 15), while the breach of the latter could prompt a probable visit to the 2023 low at 137.38 (January 3) to emerge on the horizon.
In the meantime, extra losses remain on the cards while the cross trades below the 200-day SMA.
Technical Levels: Supports and Resistances
EURJPY currently trading at 140.83 at the time of writing. Pair opened at 141.1 and is trading with a change of -0.19 % .
| Overview | Overview.1 | |
|---|---|---|
| 0 | Today last price | 140.83 |
| 1 | Today Daily Change | 138.00 |
| 2 | Today Daily Change % | -0.19 |
| 3 | Today daily open | 141.10 |
The pair remains strongly bearish on the daily time frame. It trades below the 20 SMA @ 143.83, 50 SMA 142.13, 100 SMA @ 142.96 and 200 SMA @ 141.81.
| Trends | Trends.1 | |
|---|---|---|
| 0 | Daily SMA20 | 143.83 |
| 1 | Daily SMA50 | 142.13 |
| 2 | Daily SMA100 | 142.96 |
| 3 | Daily SMA200 | 141.81 |
The previous day high was 144.96 while the previous day low was 139.48. The daily 38.2% Fib levels comes at 141.58, expected to provide resistance. Similarly, the daily 61.8% fib level is at 142.87, expected to provide resistance.
Note the levels of interest below:
- Pivot support is noted at 138.74, 136.37, 133.25
- Pivot resistance is noted at 144.22, 147.33, 149.7
| Levels | Levels.1 |
|---|---|
| Previous Daily High | 144.96 |
| Previous Daily Low | 139.48 |
| Previous Weekly High | 145.44 |
| Previous Weekly Low | 143.35 |
| Previous Monthly High | 145.47 |
| Previous Monthly Low | 139.55 |
| Daily Fibonacci 38.2% | 141.58 |
| Daily Fibonacci 61.8% | 142.87 |
| Daily Pivot Point S1 | 138.74 |
| Daily Pivot Point S2 | 136.37 |
| Daily Pivot Point S3 | 133.25 |
| Daily Pivot Point R1 | 144.22 |
| Daily Pivot Point R2 | 147.33 |
| Daily Pivot Point R3 | 149.70 |
[/s2If]
Join Our Telegram Group
")


