#AUDUSD @ 0.66472 attracts fresh buying on Thursday, albeit seems to struggle to capitalize on the move. (Pivot Orderbook analysis)
…
This is a premium post.
[s2If !current_user_can(access_s2member_level4)]Please register for PREMIUM VERSION HERE to read full post below containing analysis. In case of any error or you think you are not able to read the full post below, please email us at support#nehcap.com [lwa][/s2If] [s2If current_user_can(access_s2member_level4)]
- AUD/USD attracts fresh buying on Thursday, albeit seems to struggle to capitalize on the move.
- The upbeat Australian jobs data benefits the domestic currency amid a modest USD weakness.
- Banking crisis fears, hawkish Fed expectations limit the USD losses and seem to cap the major.
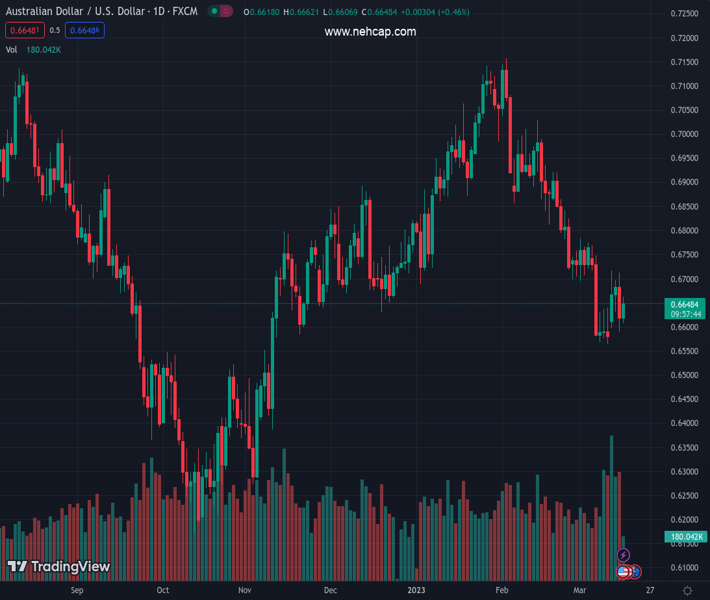
The pair currently trades last at 0.66472.
The previous day high was 0.6712 while the previous day low was 0.659. The daily 38.2% Fib levels comes at 0.6636, expected to provide support. Similarly, the daily 61.8% fib level is at 0.6665, expected to provide resistance.
The AUD/USD pair regains positive traction on Thursday and reverses a major part of the previous day’s slide to sub-0.6600 levels, or the weekly low. The pair, however, retreats a few pips from the daily peak touched during the first half of the European session and is currently placed around the 0.6640-0.6645 region, still up nearly 0.40% for the day.
A positive development surrounding the Credit Suisse saga, along with the upbeat Australian employment figures, turns out to be a key factor lending support to the AUD/USD pair amid a modest US Dollar weakness. In fact, the troubled Swiss bank announced this Thursday that it will exercise an option to borrow up to $54 billion from the Swiss National Bank (SNB) to shore up the liquidity. The Aussie gets an additional lift after the Australian Bureau of Statistics (ABS) reported that the unemployment rate in February fell back to match the lowest level since the 1970s set in December.
That said, concerns about a broader systemic risk, especially after last week’s collapse of two mid-size US banks – Silicon Valley Bank and Signature Bank – keep a lid on any optimism. This is evident from the prevalent cautious mood around the equity markets, which acts as a headwind for the risk-sensitive Aussie. Apart from this, expectations that the Fed will hike interest rates by at least 25 bps at its upcoming meeting on March 21-22 help limits deeper losses for the safe-haven Greenback and further contribute to capping the upside for the AUD/USD pair, at least for the time being.
The aforementioned fundamental backdrop, along with the Reserve Bank of Australia’s (RBA) dovish shift recently, signalling that it might be nearing the end of its rate-hiking cycle, favours the AUD/USD bears. Even from a technical perspective, this week’s repeated failures to find acceptance above the 0.6700 round-figure mark suggest that the path of least resistance for spot prices is to the downside. Market participants now look to the US economic docket, featuring Weekly Initial Jobless Claims, the Philly Fed Manufacturing Index, Building Permits and Housing Starts, for a fresh impetus.
Technical Levels: Supports and Resistances
AUDUSD currently trading at 0.6642 at the time of writing. Pair opened at 0.6619 and is trading with a change of 0.35 % .
| Overview | Overview.1 | |
|---|---|---|
| 0 | Today last price | 0.6642 |
| 1 | Today Daily Change | 0.0023 |
| 2 | Today Daily Change % | 0.3500 |
| 3 | Today daily open | 0.6619 |
The pair remains strongly bearish on the daily time frame. It trades below the 20 SMA @ 0.6732, 50 SMA 0.6876, 100 SMA @ 0.6773 and 200 SMA @ 0.6769.
| Trends | Trends.1 | |
|---|---|---|
| 0 | Daily SMA20 | 0.6732 |
| 1 | Daily SMA50 | 0.6876 |
| 2 | Daily SMA100 | 0.6773 |
| 3 | Daily SMA200 | 0.6769 |
The previous day high was 0.6712 while the previous day low was 0.659. The daily 38.2% Fib levels comes at 0.6636, expected to provide support. Similarly, the daily 61.8% fib level is at 0.6665, expected to provide resistance.
Note the levels of interest below:
- Pivot support is noted at 0.6569, 0.6518, 0.6447
- Pivot resistance is noted at 0.669, 0.6762, 0.6812
| Levels | Levels.1 |
|---|---|
| Previous Daily High | 0.6712 |
| Previous Daily Low | 0.6590 |
| Previous Weekly High | 0.6770 |
| Previous Weekly Low | 0.6564 |
| Previous Monthly High | 0.7158 |
| Previous Monthly Low | 0.6698 |
| Daily Fibonacci 38.2% | 0.6636 |
| Daily Fibonacci 61.8% | 0.6665 |
| Daily Pivot Point S1 | 0.6569 |
| Daily Pivot Point S2 | 0.6518 |
| Daily Pivot Point S3 | 0.6447 |
| Daily Pivot Point R1 | 0.6690 |
| Daily Pivot Point R2 | 0.6762 |
| Daily Pivot Point R3 | 0.6812 |
[/s2If]
Join Our Telegram Group
")


