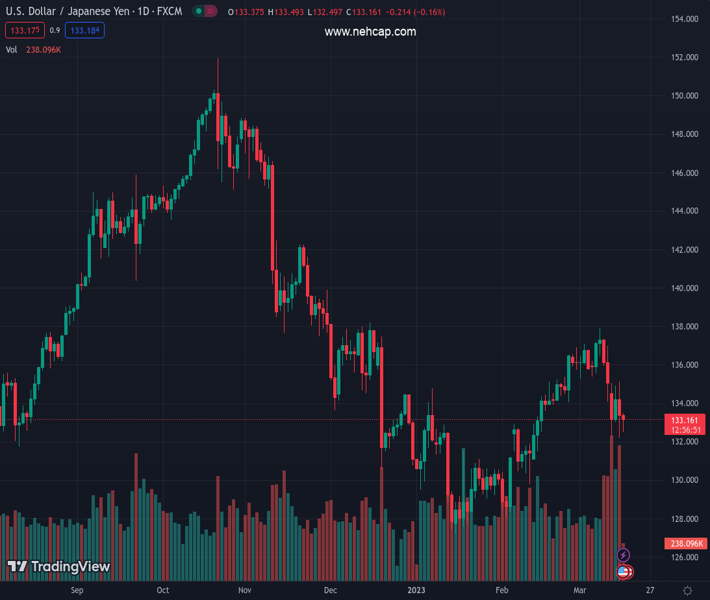
#USDJPY @ 133.078 remains under some selling pressure for the second straight day on Thursday. (Pivot Orderbook analysis)
…
This is a premium post.
[s2If !current_user_can(access_s2member_level4)]Please register for PREMIUM VERSION HERE to read full post below containing analysis. In case of any error or you think you are not able to read the full post below, please email us at support#nehcap.com [lwa][/s2If] [s2If current_user_can(access_s2member_level4)]
- USD/JPY remains under some selling pressure for the second straight day on Thursday.
- Concerns about a full-blown global banking crisis benefit the JPY and weigh on the pair.
- A modest USD weakness further contributes to the offered tone surrounding the major.
The pair currently trades last at 133.078.
The previous day high was 135.12 while the previous day low was 132.22. The daily 38.2% Fib levels comes at 133.32, expected to provide resistance. Similarly, the daily 61.8% fib level is at 134.01, expected to provide resistance.
The USD/JPY pair struggles to capitalize on the overnight late rebound from the 132.20 area, or a one-month low and attracts some sellers for the second successive day on Thursday. The pair, however, manages to rebound a few pips from the daily low and trades around the 133.00 mark during the early European session, still down nearly 0.40% for the day.
Despite the positive development surrounding the Credit Suisse saga, concerns about fresh turmoil in the global banking sector continue to drive haven flows towards the Japanese Yen (JPY) and exert pressure on the USD/JPY pair. The troubled Swiss bank announced that it will exercise an option to borrow up to $54 billion from the Swiss National Bank (SNB) to shore up liquidity. Investors, however, remain worried about a broader systemic crisis in the wake of the collapse of two mid-size US banks – Silicon Valley Bank and Signature Bank. This is evident from the prevalent cautious market mood and benefits traditional safe-haven currencies.
Apart from this, a modest US Dollar weakness turns out to be another factor acting as a headwind for the USD/JPY pair, though the prospects for further policy tightening by the Federal Reserve help limit losses. Investors still expect the US central bank to deliver at least a 25 bps rate hike at its upcoming policy meeting on March 21-22. In contrast, the Bank of Japan (BoJ) is expected to stick to its dovish stance to support the fragile domestic economy. In fact, the incoming BoJ Governor Kazuo Ueda recently stressed the need to maintain the ultra-loose policy settings and said that the central bank isn’t seeking a quick move away from a decade of massive easing.
The aforementioned fundamental backdrop warrants caution before placing aggressive bearish bets around the USD/JPY pair and positioning for an extension of last week’s rejection slide from the 200-day Simple Moving Average (SMA). Traders now look to the US economic docket, featuring the release of the usual Weekly Initial Jobless Claims, the Philly Fed Manufacturing Index, Building Permits and Housing Starts. Apart from this, the European Central Bank (ECB)-inspired volatility could provide a fresh impetus.
Technical Levels: Supports and Resistances
USDJPY currently trading at 133.04 at the time of writing. Pair opened at 133.42 and is trading with a change of -0.28 % .
| Overview | Overview.1 | |
|---|---|---|
| 0 | Today last price | 133.04 |
| 1 | Today Daily Change | -0.38 |
| 2 | Today Daily Change % | -0.28 |
| 3 | Today daily open | 133.42 |
The pair is trading below its 20 Daily moving average @ 135.33, above its 50 Daily moving average @ 132.54 , below its 100 Daily moving average @ 135.56 and below its 200 Daily moving average @ 137.49
| Trends | Trends.1 | |
|---|---|---|
| 0 | Daily SMA20 | 135.33 |
| 1 | Daily SMA50 | 132.54 |
| 2 | Daily SMA100 | 135.56 |
| 3 | Daily SMA200 | 137.49 |
The previous day high was 135.12 while the previous day low was 132.22. The daily 38.2% Fib levels comes at 133.32, expected to provide resistance. Similarly, the daily 61.8% fib level is at 134.01, expected to provide resistance.
Note the levels of interest below:
- Pivot support is noted at 132.05, 130.68, 129.15
- Pivot resistance is noted at 134.95, 136.48, 137.85
| Levels | Levels.1 |
|---|---|
| Previous Daily High | 135.12 |
| Previous Daily Low | 132.22 |
| Previous Weekly High | 137.91 |
| Previous Weekly Low | 134.12 |
| Previous Monthly High | 136.92 |
| Previous Monthly Low | 128.08 |
| Daily Fibonacci 38.2% | 133.32 |
| Daily Fibonacci 61.8% | 134.01 |
| Daily Pivot Point S1 | 132.05 |
| Daily Pivot Point S2 | 130.68 |
| Daily Pivot Point S3 | 129.15 |
| Daily Pivot Point R1 | 134.95 |
| Daily Pivot Point R2 | 136.48 |
| Daily Pivot Point R3 | 137.85 |
[/s2If]
Join Our Telegram Group
")


