#EURGBP @ 0.87851 picks up bids to consolidate the biggest daily loss in three weeks., @nehcap view: Limited upside expected (Pivot Orderbook analysis)
…
This is a premium post.
[s2If !current_user_can(access_s2member_level4)]Please register for PREMIUM VERSION HERE to read full post below containing analysis. In case of any error or you think you are not able to read the full post below, please email us at support#nehcap.com [lwa][/s2If] [s2If current_user_can(access_s2member_level4)]
- EUR/GBP picks up bids to consolidate the biggest daily loss in three weeks.
- Bearish oscillators, sustained trading below one-week-old descending trend line keep sellers hopeful.
- Bears could aim for 61.8% Fibonacci retracement, 200-DMA on breaking immediate support.
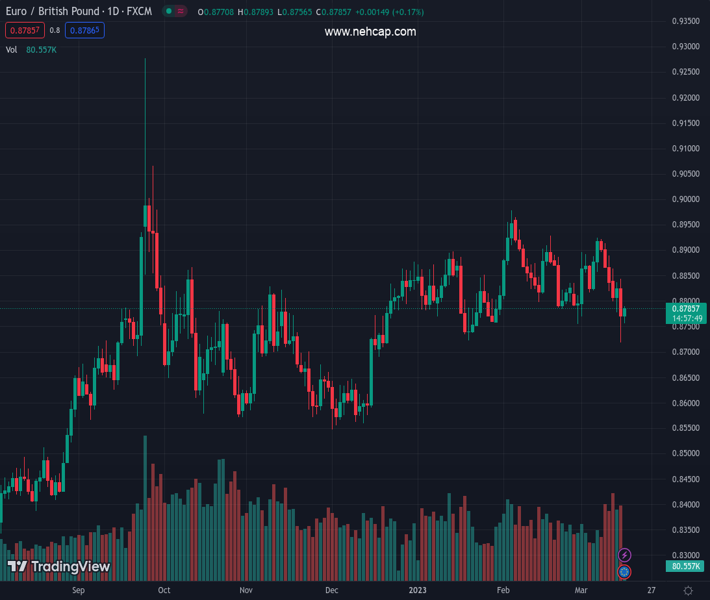
The pair currently trades last at 0.87851.
The previous day high was 0.8844 while the previous day low was 0.8718. The daily 38.2% Fib levels comes at 0.8766, expected to provide support. Similarly, the daily 61.8% fib level is at 0.8796, expected to provide resistance.
EUR/GBP renews intraday high near 0.8790 as it extends the late Wednesday’s bounce off the lowest levels since December 2022 heading into Thursday’s European session. In doing so, the cross-currency pair rebounds from the 100-DMA while paring the biggest daily loss in three weeks ahead of the key European Central Bank’s (ECB) Monetary Policy Meeting.
Although the key moving average allows buyers to return to the desk, their dominance remains doubtful as the MACD flashes bearish MACD signals. Also challenging the upside bias are the downbeat conditions of the RSI (14) line, not oversold, as well as a one-week-old descending trend line, around 0.8815.
Even if the EUR/GBP recovery crosses the 0.8815 immediate hurdle, the 0.8900 threshold and 0.8930 resistance level can challenge the pair’s further advances before directing bulls towards the yearly high marked in February near 0.8980.
Meanwhile, pullback moves need a daily closing below the 100-DMA support of 0.8770, as well as the 50% Fibonacci retracement level of the pair’s December 2022 to February 2023 upside near 0.8760, to convince sellers.
Following that, the 61.8% Fibonacci retracement, also known as the golden Fibonacci ratio, could challenge the EUR/GBP bears around 0.8710 ahead of highlighting the 200-DMA support of 0.8683.
Trend: Limited upside expected
Technical Levels: Supports and Resistances
EURGBP currently trading at 0.8782 at the time of writing. Pair opened at 0.8774 and is trading with a change of 0.09% % .
| Overview | Overview.1 | |
|---|---|---|
| 0 | Today last price | 0.8782 |
| 1 | Today Daily Change | 0.0008 |
| 2 | Today Daily Change % | 0.09% |
| 3 | Today daily open | 0.8774 |
The pair is trading below its 20 Daily moving average @ 0.8845, below its 50 Daily moving average @ 0.8839 , above its 100 Daily moving average @ 0.8769 and above its 200 Daily moving average @ 0.8682
| Trends | Trends.1 | |
|---|---|---|
| 0 | Daily SMA20 | 0.8845 |
| 1 | Daily SMA50 | 0.8839 |
| 2 | Daily SMA100 | 0.8769 |
| 3 | Daily SMA200 | 0.8682 |
The previous day high was 0.8844 while the previous day low was 0.8718. The daily 38.2% Fib levels comes at 0.8766, expected to provide support. Similarly, the daily 61.8% fib level is at 0.8796, expected to provide resistance.
Note the levels of interest below:
- Pivot support is noted at 0.8713, 0.8653, 0.8588
- Pivot resistance is noted at 0.8839, 0.8904, 0.8964
| Levels | Levels.1 |
|---|---|
| Previous Daily High | 0.8844 |
| Previous Daily Low | 0.8718 |
| Previous Weekly High | 0.8925 |
| Previous Weekly Low | 0.8821 |
| Previous Monthly High | 0.8979 |
| Previous Monthly Low | 0.8755 |
| Daily Fibonacci 38.2% | 0.8766 |
| Daily Fibonacci 61.8% | 0.8796 |
| Daily Pivot Point S1 | 0.8713 |
| Daily Pivot Point S2 | 0.8653 |
| Daily Pivot Point S3 | 0.8588 |
| Daily Pivot Point R1 | 0.8839 |
| Daily Pivot Point R2 | 0.8904 |
| Daily Pivot Point R3 | 0.8964 |
[/s2If]
Join Our Telegram Group
")


