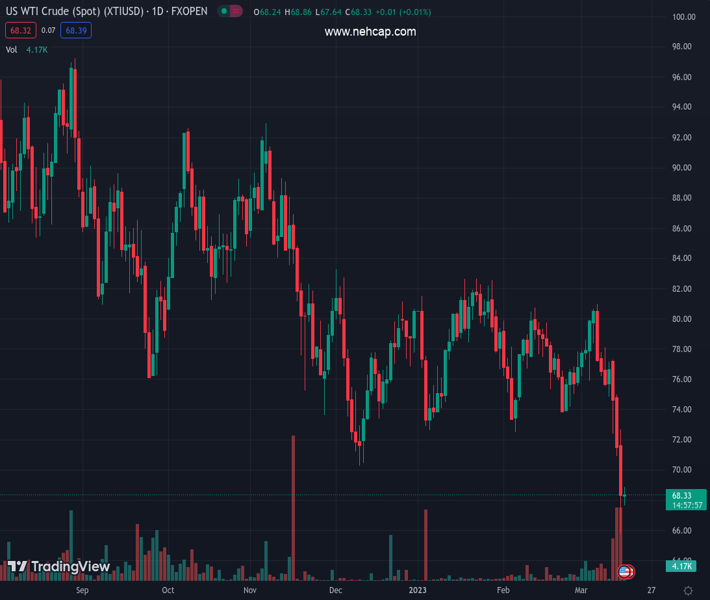
WTI hits December 2022 lows around $66 amid Credit Suisse crisis, causing a shift in global financial conditions. (Pivot Orderbook analysis)
…
This is a premium post.
[s2If !current_user_can(access_s2member_level4)]Please register for PREMIUM VERSION HERE to read full post below containing analysis. In case of any error or you think you are not able to read the full post below, please email us at support#nehcap.com [lwa][/s2If] [s2If current_user_can(access_s2member_level4)]
- WTI hits December 2022 lows around $66 amid Credit Suisse crisis, causing a shift in global financial conditions.
- Investors fading optimism for 2023 growth outlook drives Oil prices lower.
- IEA reports a drop in Russian Oil exports and an increased global oil stockpile.
The pair currently trades last at 68.48.
The previous day high was 72.69 while the previous day low was 65.81. The daily 38.2% Fib levels comes at 68.44, expected to provide support. Similarly, the daily 61.8% fib level is at 70.06, expected to provide resistance.
West Texas Intermediate (WTI) prices hit lows not seen since December 2022, with the three-day sharp decline finding its floor around the $66 mark. Short-term relief arrived on Thursday after a backup plan was introduced for Credit Suisse’s worsening financial conditions. Following Silicon Valley Bank’s (SVB) fallout, Credit Suisse was next in line to address its troublesome liquidity issue, causing its shares to plunge heavily.
The WTI price dropped earlier this week due to sudden shifts in global financial conditions, led by historically high borrowing costs. As investors’ optimistic growth outlook for 2023 fades, falling oil prices are inevitable.
With a diminishing global growth outlook, investors are abating risk assets like oil and equity complexes, and are rushing to purchase bonds in a risk-averse environment.
The International Energy Agency (IEA) published comments on Wednesday stating that Russian oil exports fell by more than 500k bpd in February. The global oil stockpile has risen to around 7.8 billion barrels, the highest level since September 2021, indicating a slower pace of oil consumption. Despite a pessimistic global growth outlook, the IEA has raised its global oil demand forecast for 2023 from 100 million bpd to 102 Mbpd.
In the medium to short term, WTI prices are likely to be driven by risk sentiment, with the downside bias remaining intact.
Technical Levels: Supports and Resistances
XTIUSD currently trading at 68.48 at the time of writing. Pair opened at 68.41 and is trading with a change of 0.1 % .
| Overview | Overview.1 | |
|---|---|---|
| 0 | Today last price | 68.48 |
| 1 | Today Daily Change | 0.07 |
| 2 | Today Daily Change % | 0.10 |
| 3 | Today daily open | 68.41 |
The pair remains strongly bearish on the daily time frame. It trades below the 20 SMA @ 76.24, 50 SMA 77.5, 100 SMA @ 79.0 and 200 SMA @ 86.09.
| Trends | Trends.1 | |
|---|---|---|
| 0 | Daily SMA20 | 76.24 |
| 1 | Daily SMA50 | 77.50 |
| 2 | Daily SMA100 | 79.00 |
| 3 | Daily SMA200 | 86.09 |
The previous day high was 72.69 while the previous day low was 65.81. The daily 38.2% Fib levels comes at 68.44, expected to provide support. Similarly, the daily 61.8% fib level is at 70.06, expected to provide resistance.
Note the levels of interest below:
- Pivot support is noted at 65.25, 62.09, 58.37
- Pivot resistance is noted at 72.13, 75.85, 79.01
| Levels | Levels.1 |
|---|---|
| Previous Daily High | 72.69 |
| Previous Daily Low | 65.81 |
| Previous Weekly High | 80.99 |
| Previous Weekly Low | 74.89 |
| Previous Monthly High | 80.75 |
| Previous Monthly Low | 72.50 |
| Daily Fibonacci 38.2% | 68.44 |
| Daily Fibonacci 61.8% | 70.06 |
| Daily Pivot Point S1 | 65.25 |
| Daily Pivot Point S2 | 62.09 |
| Daily Pivot Point S3 | 58.37 |
| Daily Pivot Point R1 | 72.13 |
| Daily Pivot Point R2 | 75.85 |
| Daily Pivot Point R3 | 79.01 |
[/s2If]
Join Our Telegram Group
")


