#USDCAD @ 1.37504 fades bounce off three-week-old support line, grinds lower of late., @nehcap view: Further downside expected (Pivot Orderbook analysis)
…
This is a premium post.
[s2If !current_user_can(access_s2member_level4)]Please register for PREMIUM VERSION HERE to read full post below containing analysis. In case of any error or you think you are not able to read the full post below, please email us at support#nehcap.com [lwa][/s2If] [s2If current_user_can(access_s2member_level4)]
- USD/CAD fades bounce off three-week-old support line, grinds lower of late.
- Receding bullish bias of MACD, descending RSI line lure sellers.
- 100, 200 EMAs act as additional downside filters.
- Weekly descending trend line holds the key to Loonie pair’s run-up towards refreshing 2023 top.
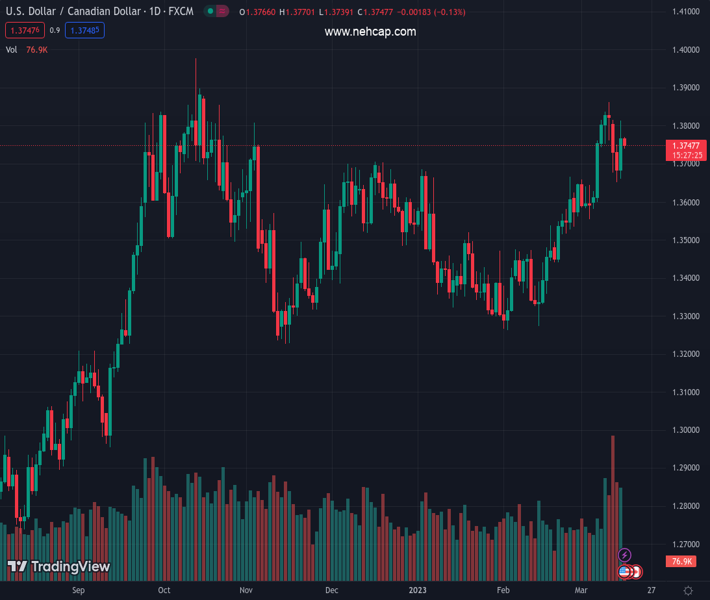
The pair currently trades last at 1.37504.
The previous day high was 1.3814 while the previous day low was 1.366. The daily 38.2% Fib levels comes at 1.3756, expected to provide resistance. Similarly, the daily 61.8% fib level is at 1.3719, expected to provide support.
USD/CAD holds lower ground near 1.3750 as it pares the biggest daily gains in a week during early Thursday morning in Europe. In doing so, the Loonie pair fades the previous day’s bounce off a three-week-old ascending support line while printing mild losses of late.
Apart from failing to rebound from the short-term key support, the receding bullish bias of the MACD signals and the RSI (14) line’s downward move, not oversold, also keeps the USD/CAD bears hopeful of poking the 1.3690 level, comprising the aforementioned trend.
It’s worth noting, however, that the 100-bar and 200-bar Exponential Moving Averages (EMAs), respectively near 1.3660 and 1.3585, could challenge the USD/CAD bears afterward.
Also acting as a downside filter is the 50% Fibonacci retracement level of the pair’s February-March upside, near 1.3565.
On the flip side, a downward-sloping resistance line from March 10, close to 1.3810 at the latest, appears crucial for the USD/CAD buyers to watch during the pair’s further upside as a clear break of which could quickly refresh the year 2023 peak, currently around 1.3860.
In that case, October 2022 peak surrounding 1.3980 and the 1.4000 psychological magnet will gain major attention.
Trend: Further downside expected
Technical Levels: Supports and Resistances
USDCAD currently trading at 1.3745 at the time of writing. Pair opened at 1.3767 and is trading with a change of -0.16% % .
| Overview | Overview.1 | |
|---|---|---|
| 0 | Today last price | 1.3745 |
| 1 | Today Daily Change | -0.0022 |
| 2 | Today Daily Change % | -0.16% |
| 3 | Today daily open | 1.3767 |
The pair remains strongly bullish on the daily timeframe. It trades above its 20 SMA @ 1.3632, 50 SMA 1.3489, 100 SMA @ 1.3507 and 200 SMA @ 1.333.
| Trends | Trends.1 | |
|---|---|---|
| 0 | Daily SMA20 | 1.3632 |
| 1 | Daily SMA50 | 1.3489 |
| 2 | Daily SMA100 | 1.3507 |
| 3 | Daily SMA200 | 1.3330 |
The previous day high was 1.3814 while the previous day low was 1.366. The daily 38.2% Fib levels comes at 1.3756, expected to provide resistance. Similarly, the daily 61.8% fib level is at 1.3719, expected to provide support.
Note the levels of interest below:
- Pivot support is noted at 1.368, 1.3593, 1.3526
- Pivot resistance is noted at 1.3835, 1.3902, 1.3989
| Levels | Levels.1 |
|---|---|
| Previous Daily High | 1.3814 |
| Previous Daily Low | 1.3660 |
| Previous Weekly High | 1.3862 |
| Previous Weekly Low | 1.3582 |
| Previous Monthly High | 1.3666 |
| Previous Monthly Low | 1.3262 |
| Daily Fibonacci 38.2% | 1.3756 |
| Daily Fibonacci 61.8% | 1.3719 |
| Daily Pivot Point S1 | 1.3680 |
| Daily Pivot Point S2 | 1.3593 |
| Daily Pivot Point S3 | 1.3526 |
| Daily Pivot Point R1 | 1.3835 |
| Daily Pivot Point R2 | 1.3902 |
| Daily Pivot Point R3 | 1.3989 |
[/s2If]
Join Our Telegram Group
")


