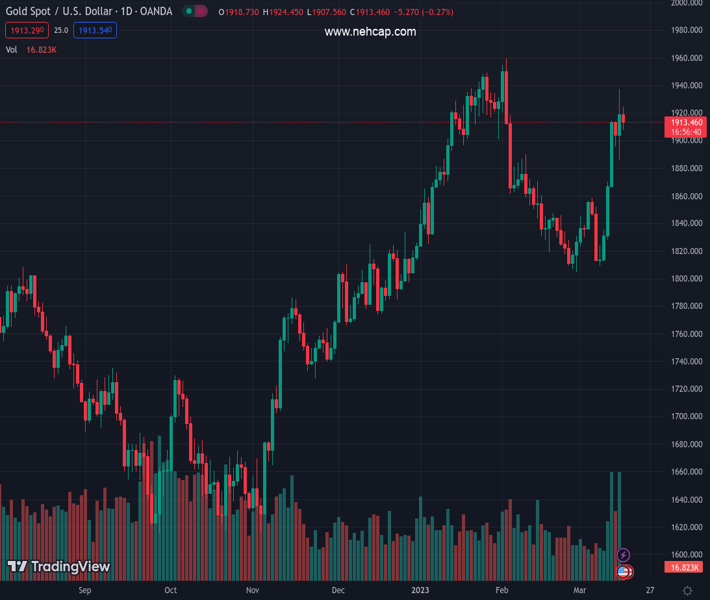
#XAUUSD @ 1,913.17 Gold price has sensed selling pressure while extending its rally, however, the upside is still solid. (Pivot Orderbook analysis)
…
This is a premium post.
[s2If !current_user_can(access_s2member_level4)]Please register for PREMIUM VERSION HERE to read full post below containing analysis. In case of any error or you think you are not able to read the full post below, please email us at support#nehcap.com [lwa][/s2If] [s2If current_user_can(access_s2member_level4)]
- Gold price has sensed selling pressure while extending its rally, however, the upside is still solid.
- The USD Index is expected to face the heat of uncertainty over monetary policy by the Fed, scheduled for next week.
- Rising odds for an unchanged Fed’s monetary policy are backed by softening US inflation and a higher jobless rate.
The pair currently trades last at 1913.17.
The previous day high was 1937.39 while the previous day low was 1885.77. The daily 38.2% Fib levels comes at 1917.67, expected to provide resistance. Similarly, the daily 61.8% fib level is at 1905.49, expected to provide support.
Gold price (XAU/USD) has demonstrated a corrective move in the Asian session after printing a fresh six-week high at $1,937.39. A correction in the precious metal looks short-lived as gold’s appeal is extremely solid amid deepening fears of the global banking crisis. Credit Suisse’s fiasco after the collapse of Silicon Valley Bank (SVB) has triggered the risk of financial instability globally and uncertainty over the interest rate decision by the Federal Reserve (Fed), scheduled for next week, has cemented strong appeal for Gold price.
S&P500 futures have shown a recovery move after a sell-off on Wednesday as investors are digesting the uncertainty associated with the banking sector. However, the risk aversion theme has not completely faded yet.
The US Dollar Index (DXY) is juggling in a narrow range of around 104.60 in the Asian session. It seems that the impact of banking sector turmoil is maturing for the USD Index and investors are starting to discount the expectations for next week’s monetary policy. As per the CME FedWatch tool, the odds for a 25 basis point (bps) interest rate hike by Fed chair Jerome Powell have scaled above 70%. While 30% chances are advocating an unchanged interest rate policy.
Rising odds for an unchanged monetary policy are backed by softening United States Consumer Price Index (CPI), higher Unemployment Rate, weak Retail Sales, and lower Producer Price Index (PPI) figures.
Gold price has corrected after a bearish divergence on a two-hour scale as the asset formed a higher high while the Relative Strength Index (RSI) (14) formed a lower high that resulted in a loss in the upside momentum. The upside bias is still sold as the asset has not broken the higher high higher low structure.
The Gold price has shown a mean reversion to near the 20-period Exponential Moving Average (EMA) at $1,910.30 after a perpendicular move.
The Yellow metal has comfortably established above the 61.8% Fibonacci retracement (placed from February 02 high at $1,959.80 to February 28 low at $1,804.76) at $1,900.00.
Technical Levels: Supports and Resistances
XAUUSD currently trading at 1913.12 at the time of writing. Pair opened at 1918.54 and is trading with a change of -0.28 % .
| Overview | Overview.1 | |
|---|---|---|
| 0 | Today last price | 1913.12 |
| 1 | Today Daily Change | -5.42 |
| 2 | Today Daily Change % | -0.28 |
| 3 | Today daily open | 1918.54 |
The pair remains strongly bullish on the daily timeframe. It trades above its 20 SMA @ 1844.9, 50 SMA 1875.45, 100 SMA @ 1818.14 and 200 SMA @ 1776.01.
| Trends | Trends.1 | |
|---|---|---|
| 0 | Daily SMA20 | 1844.90 |
| 1 | Daily SMA50 | 1875.45 |
| 2 | Daily SMA100 | 1818.14 |
| 3 | Daily SMA200 | 1776.01 |
The previous day high was 1937.39 while the previous day low was 1885.77. The daily 38.2% Fib levels comes at 1917.67, expected to provide resistance. Similarly, the daily 61.8% fib level is at 1905.49, expected to provide support.
Note the levels of interest below:
- Pivot support is noted at 1890.41, 1862.28, 1838.79
- Pivot resistance is noted at 1942.03, 1965.52, 1993.65
| Levels | Levels.1 |
|---|---|
| Previous Daily High | 1937.39 |
| Previous Daily Low | 1885.77 |
| Previous Weekly High | 1870.09 |
| Previous Weekly Low | 1809.46 |
| Previous Monthly High | 1959.80 |
| Previous Monthly Low | 1804.76 |
| Daily Fibonacci 38.2% | 1917.67 |
| Daily Fibonacci 61.8% | 1905.49 |
| Daily Pivot Point S1 | 1890.41 |
| Daily Pivot Point S2 | 1862.28 |
| Daily Pivot Point S3 | 1838.79 |
| Daily Pivot Point R1 | 1942.03 |
| Daily Pivot Point R2 | 1965.52 |
| Daily Pivot Point R3 | 1993.65 |
[/s2If]
Join Our Telegram Group
")


