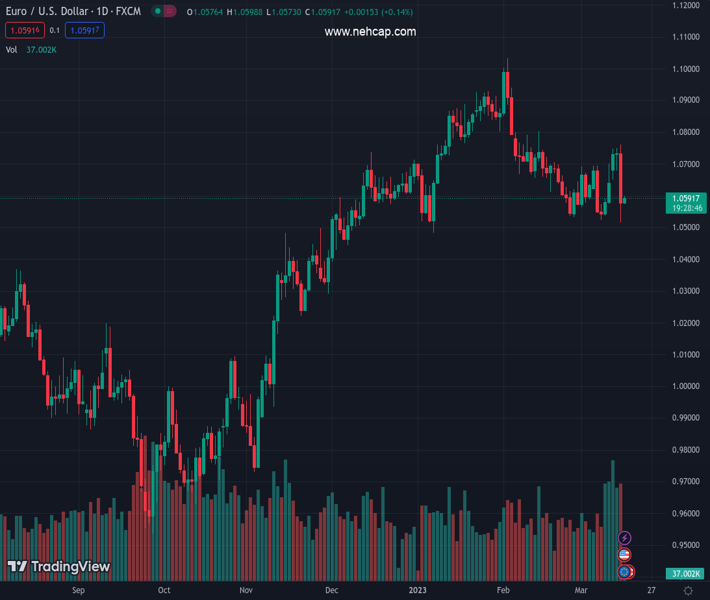
#EURUSD @ 1.05912 is likely to remain in action ahead of the interest rate decision by the ECB. (Pivot Orderbook analysis)
…
This is a premium post.
[s2If !current_user_can(access_s2member_level4)]Please register for PREMIUM VERSION HERE to read full post below containing analysis. In case of any error or you think you are not able to read the full post below, please email us at support#nehcap.com [lwa][/s2If] [s2If current_user_can(access_s2member_level4)]
- EUR/USD is likely to remain in action ahead of the interest rate decision by the ECB.
- The Euro has shown responsive buying from below 1.0530 amid hawkish ECB bets.
- The RSI (14) is making efforts in leaving the bearish range oscillation, which indicates a bullish reversal.
The pair currently trades last at 1.05912.
The previous day high was 1.076 while the previous day low was 1.0516. The daily 38.2% Fib levels comes at 1.0609, expected to provide resistance. Similarly, the daily 61.8% fib level is at 1.0667, expected to provide resistance.
The EUR/USD pair has stretched its recovery to near the round-level resistance of 1.0600 in the Asian session. The major currency pair is attracting bids as the European Central Bank (ECB) is expected to maintain its higher gear for interest rates ahead. An announcement of third consecutive 50 basis points (bps) is expected in the interest rate decision by ECB President Christine Lagarde despite Credit Suisse’s fiasco as stubborn Eurozone inflation is needed to be prioritized.
S&P500 futures are showing decent gains in the Asian session, indicating that investors are digesting the turmoil of Credit Suisse, however, the risk aversion is not entirely faded yet. The US Dollar Index (DXY) has extended its correction to 104.54 as the rally was backed by fears of a global banking crisis, not of bigger rates announcement by the Federal Reserve (Fed).
EUR/USD has shown a recovery move after testing the horizontal support plotted from February 27 low at 1.0533 on a two-hour scale. The shared currency pair has shown a responsive buying move, which indicates a ‘value buying’ at lower levels.
The 20-period Exponential Moving Average (EMA) at 1.0638 is still declining, which indicates that the short-term trend is bearish.
Contrary to that, the Relative Strength Index (RSI) (14) is making efforts in leaving the bearish range oscillation, which indicates a bullish reversal.
For further action, a decisive move above the round-level resistance at 1.0600 will drive the asset toward February 28 high at 1.0645. A breach above the latter will expose the asset to March 01 high at 1.0691.
On the flip side, a slippage below February 27 low at 1.0533 would expose the asset to psychological support at 1.0500 and December 07 low at 1.0443.
Technical Levels: Supports and Resistances
EURUSD currently trading at 1.059 at the time of writing. Pair opened at 1.0577 and is trading with a change of 0.12 % .
| Overview | Overview.1 | |
|---|---|---|
| 0 | Today last price | 1.0590 |
| 1 | Today Daily Change | 0.0013 |
| 2 | Today Daily Change % | 0.1200 |
| 3 | Today daily open | 1.0577 |
The pair is trading below its 20 Daily moving average @ 1.0629, below its 50 Daily moving average @ 1.0726 , above its 100 Daily moving average @ 1.0556 and above its 200 Daily moving average @ 1.0325
| Trends | Trends.1 | |
|---|---|---|
| 0 | Daily SMA20 | 1.0629 |
| 1 | Daily SMA50 | 1.0726 |
| 2 | Daily SMA100 | 1.0556 |
| 3 | Daily SMA200 | 1.0325 |
The previous day high was 1.076 while the previous day low was 1.0516. The daily 38.2% Fib levels comes at 1.0609, expected to provide resistance. Similarly, the daily 61.8% fib level is at 1.0667, expected to provide resistance.
Note the levels of interest below:
- Pivot support is noted at 1.0475, 1.0374, 1.0232
- Pivot resistance is noted at 1.0719, 1.0861, 1.0963
| Levels | Levels.1 |
|---|---|
| Previous Daily High | 1.0760 |
| Previous Daily Low | 1.0516 |
| Previous Weekly High | 1.0701 |
| Previous Weekly Low | 1.0524 |
| Previous Monthly High | 1.1033 |
| Previous Monthly Low | 1.0533 |
| Daily Fibonacci 38.2% | 1.0609 |
| Daily Fibonacci 61.8% | 1.0667 |
| Daily Pivot Point S1 | 1.0475 |
| Daily Pivot Point S2 | 1.0374 |
| Daily Pivot Point S3 | 1.0232 |
| Daily Pivot Point R1 | 1.0719 |
| Daily Pivot Point R2 | 1.0861 |
| Daily Pivot Point R3 | 1.0963 |
[/s2If]
Join Our Telegram Group
")


