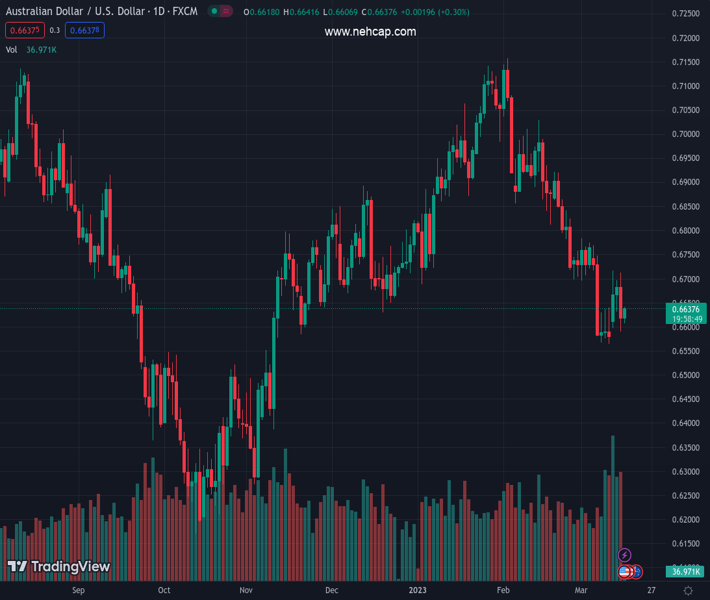
#AUDUSD @ 0.66347 has stretched its recovery to near 0.6640 on better-than-projected Australian labor market data. (Pivot Orderbook analysis)
…
This is a premium post.
[s2If !current_user_can(access_s2member_level4)]Please register for PREMIUM VERSION HERE to read full post below containing analysis. In case of any error or you think you are not able to read the full post below, please email us at support#nehcap.com [lwa][/s2If] [s2If current_user_can(access_s2member_level4)]
- AUD/USD has stretched its recovery to near 0.6640 on better-than-projected Australian labor market data.
- RBA Lowe Lowe might continue to target more rates as a higher labor force in action would result in spiking inflation further.
- Investors believe that the reason behind global banking system failure is the fastest and steepest rate hikes by the Fed.
The pair currently trades last at 0.66347.
The previous day high was 0.6712 while the previous day low was 0.659. The daily 38.2% Fib levels comes at 0.6636, expected to provide resistance. Similarly, the daily 61.8% fib level is at 0.6665, expected to provide resistance.
The AUD/USD pair has extended its recovery to near 0.6640 as the Australian Bureau of Statistics has reported upbeat Employment data. The Australian economy added fresh 64.6K payrolls in February higher than the consensus of 48.5K. In January, the Australian economy reported 11.5K lay-offs. The Unemployment Rate has been trimmed further to 3.5% from the estimates of 3.6% and the prior release of 3.7%.
An upbeat Australian labor market data is going to add to troubles for the Reserve Bank of Australia (RBA), which is designing the roadmap for bringing inflation down. RBA Governor Philip Lowe might continue to target more rates as a higher labor force in action would result in spiking inflationary pressures further.
Earlier, Australian Consumer Inflation Expectations (Mar) data that demonstrate inflation projections for the next 12 months dropped to 5.0% from the consensus of 5.4% and the former release of 5.1%.
Meanwhile, S&P500 futures are showing minimal gains in the Asian session, which could be considered as a dead cat bounce after turmoil on Wednesday. The debacle of Credit Suisse after the Silicon Valley Bank (SVB) collapse has deepened the risk of global banking turmoil. One school of thought believes that the rationale behind global banking system failure is the fastest and steepest interest rate hikes by the Federal Reserve (Fed) and other western central banks.
The US Dollar Index (DXY) is looking to extend its correction below 104.60 as investors are expecting a less-hawkish interest rate decision by the Federal Reserve (Fed), scheduled for next week. After a one-time blip in the United States inflation in January, the US inflation has re-routed south, which has faded the expectations of a severe hawkish stance from Fed chair Jerome Powell.
Technical Levels: Supports and Resistances
AUDUSD currently trading at 0.6631 at the time of writing. Pair opened at 0.6619 and is trading with a change of 0.18 % .
| Overview | Overview.1 | |
|---|---|---|
| 0 | Today last price | 0.6631 |
| 1 | Today Daily Change | 0.0012 |
| 2 | Today Daily Change % | 0.1800 |
| 3 | Today daily open | 0.6619 |
The pair remains strongly bearish on the daily time frame. It trades below the 20 SMA @ 0.6732, 50 SMA 0.6876, 100 SMA @ 0.6773 and 200 SMA @ 0.6769.
| Trends | Trends.1 | |
|---|---|---|
| 0 | Daily SMA20 | 0.6732 |
| 1 | Daily SMA50 | 0.6876 |
| 2 | Daily SMA100 | 0.6773 |
| 3 | Daily SMA200 | 0.6769 |
The previous day high was 0.6712 while the previous day low was 0.659. The daily 38.2% Fib levels comes at 0.6636, expected to provide resistance. Similarly, the daily 61.8% fib level is at 0.6665, expected to provide resistance.
Note the levels of interest below:
- Pivot support is noted at 0.6569, 0.6518, 0.6447
- Pivot resistance is noted at 0.669, 0.6762, 0.6812
| Levels | Levels.1 |
|---|---|
| Previous Daily High | 0.6712 |
| Previous Daily Low | 0.6590 |
| Previous Weekly High | 0.6770 |
| Previous Weekly Low | 0.6564 |
| Previous Monthly High | 0.7158 |
| Previous Monthly Low | 0.6698 |
| Daily Fibonacci 38.2% | 0.6636 |
| Daily Fibonacci 61.8% | 0.6665 |
| Daily Pivot Point S1 | 0.6569 |
| Daily Pivot Point S2 | 0.6518 |
| Daily Pivot Point S3 | 0.6447 |
| Daily Pivot Point R1 | 0.6690 |
| Daily Pivot Point R2 | 0.6762 |
| Daily Pivot Point R3 | 0.6812 |
[/s2If]
Join Our Telegram Group
")


