US Dollar Index pares the biggest daily gains in a week, renews intraday low of late. (Pivot Orderbook analysis)
…
This is a premium post.
[s2If !current_user_can(access_s2member_level4)]Please register for PREMIUM VERSION HERE to read full post below containing analysis. In case of any error or you think you are not able to read the full post below, please email us at support#nehcap.com [lwa][/s2If] [s2If current_user_can(access_s2member_level4)]
- US Dollar Index pares the biggest daily gains in a week, renews intraday low of late.
- Credit Suisse turmoil renews market’s fears surrounding 2008 crisis, especially after SVB, Signature Bank fallout.
- Moody’s back 0.25% Fed rate hike concerns despite recent crisis, US data came in mixed.
The pair currently trades last at 104.65.
The previous day high was 105.11 while the previous day low was 103.44. The daily 38.2% Fib levels comes at 104.47, expected to provide support. Similarly, the daily 61.8% fib level is at 104.08, expected to provide support.
US Dollar Index (DXY) renews intraday low near 104.60 as it consolidates the biggest daily gains in a week during early Thursday. That said, the market’s inaction and the global policymakers’ rush to placate the fears emanating from the Credit Suisse turmoil seem to favor the DXY’s latest pullback. However, the hawkish Fed bets and an absence of any major developments that could defy the financial market risks keeps the US Dollar Index on the bull’s radar.
The Saudi National Bank’s rejection of infusing more funds into Credit Suisse propelled the key European bank’s Credit Default Swaps (CDS) and triggered the crisis for the financial markets on Wednesday. On the same line was the news that the European Central Bank (ECB) officials contacted banks to ask about exposures to Credit Suisse, which in turn fanned the risk-off mood.
To tame the risk aversion, the Swiss National Bank stepped forward while anonymous sources conveyed to Reuters that the US banks are less vulnerable to the Credit Suisse debacle. On the same line, Bank of England (BoE) also held emergency talks. Hence, the global policymakers’ rush to placate the market’s fears seem to weigh on the DXY of late.
Furthermore, global rating giant Moody’s crossed wires via Reuters while stating that it’s analysts expect the Federal Open Market Committee (FOMC) to raise the federal funds rate by 25 basis points at its March 22 meeting.
The risk-aversion propelled the market’s demand for the US Treasury bonds and drowned the yields, which in turn allowed the greenback’s gauge versus six major currencies to rally despite unimpressive data. That said, the US 10-year Treasury bond yields dropped the most in four months before bouncing off a four-month low to 3.46% at the latest. On the same line, the US two-year bond coupons refreshed a six-month low before ending the volatile Wednesday near 3.89%.
It should be noted that US Retail Sales dropped to -0.4% in February versus -0.3% expected and upwardly revised 3.2% prior while the Producer Price Index (PPI) slide to 4.6% YoY from 5.7% in January and 5.6% market forecasts. Further, NY Empire State Manufacturing Index dropped to -24.6 for March compared to analysts’ estimations of -8.0 and -5.8 prior.
Looking ahead, the second-tier data surrounding employment and activities from the US will join the risk catalysts to direct intraday DXY moves. Also important to watch will be the European Central Bank’s (ECB) action considering the latest banking fiasco in the bloc. Above all, bond market is the key to follow for fresh impulse.
Failure to cross the 100-DMA, around 104.90 by the press time, directs US Dollar Index towards another attempt to break the 50-DMA support surrounding 103.45.
Technical Levels: Supports and Resistances
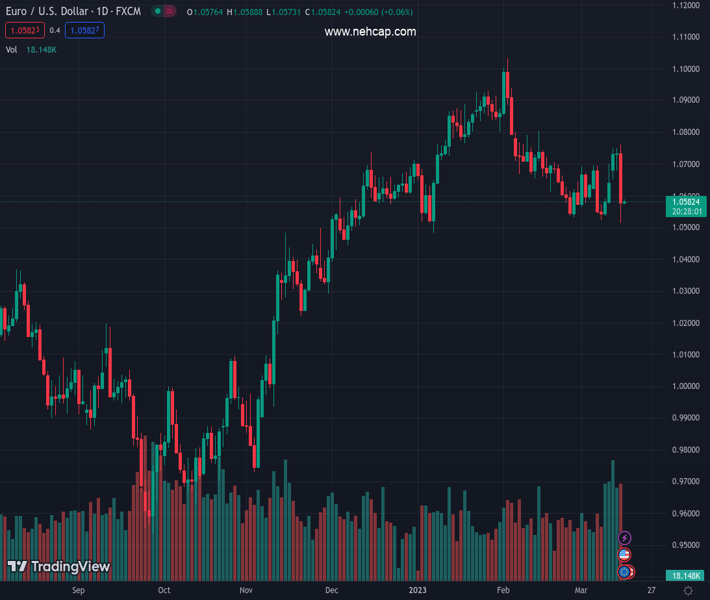
EURUSD currently trading at 104.65 at the time of writing. Pair opened at 104.75 and is trading with a change of -0.10% % .
| Overview | Overview.1 | |
|---|---|---|
| 0 | Today last price | 104.65 |
| 1 | Today Daily Change | -0.10 |
| 2 | Today Daily Change % | -0.10% |
| 3 | Today daily open | 104.75 |
The pair is trading above its 20 Daily moving average @ 104.57, above its 50 Daily moving average @ 103.46 , above its 100 Daily moving average @ 104.43 and below its 200 Daily moving average @ 106.84
| Trends | Trends.1 | |
|---|---|---|
| 0 | Daily SMA20 | 104.57 |
| 1 | Daily SMA50 | 103.46 |
| 2 | Daily SMA100 | 104.43 |
| 3 | Daily SMA200 | 106.84 |
The previous day high was 105.11 while the previous day low was 103.44. The daily 38.2% Fib levels comes at 104.47, expected to provide support. Similarly, the daily 61.8% fib level is at 104.08, expected to provide support.
Note the levels of interest below:
- Pivot support is noted at 103.76, 102.77, 102.1
- Pivot resistance is noted at 105.43, 106.1, 107.09
| Levels | Levels.1 |
|---|---|
| Previous Daily High | 105.11 |
| Previous Daily Low | 103.44 |
| Previous Weekly High | 105.89 |
| Previous Weekly Low | 104.05 |
| Previous Monthly High | 105.36 |
| Previous Monthly Low | 100.81 |
| Daily Fibonacci 38.2% | 104.47 |
| Daily Fibonacci 61.8% | 104.08 |
| Daily Pivot Point S1 | 103.76 |
| Daily Pivot Point S2 | 102.77 |
| Daily Pivot Point S3 | 102.10 |
| Daily Pivot Point R1 | 105.43 |
| Daily Pivot Point R2 | 106.10 |
| Daily Pivot Point R3 | 107.09 |
[/s2If]
Join Our Telegram Group
")


