WTI drops hard on technical selling and in risk-off markets. (Pivot Orderbook analysis)
…
This is a premium post.
[s2If !current_user_can(access_s2member_level4)]Please register for PREMIUM VERSION HERE to read full post below containing analysis. In case of any error or you think you are not able to read the full post below, please email us at support#nehcap.com [lwa][/s2If] [s2If current_user_can(access_s2member_level4)]
- WTI drops hard on technical selling and in risk-off markets.
- Institutions were dumping crude futures to limit their exposure to falling prices in the options market.
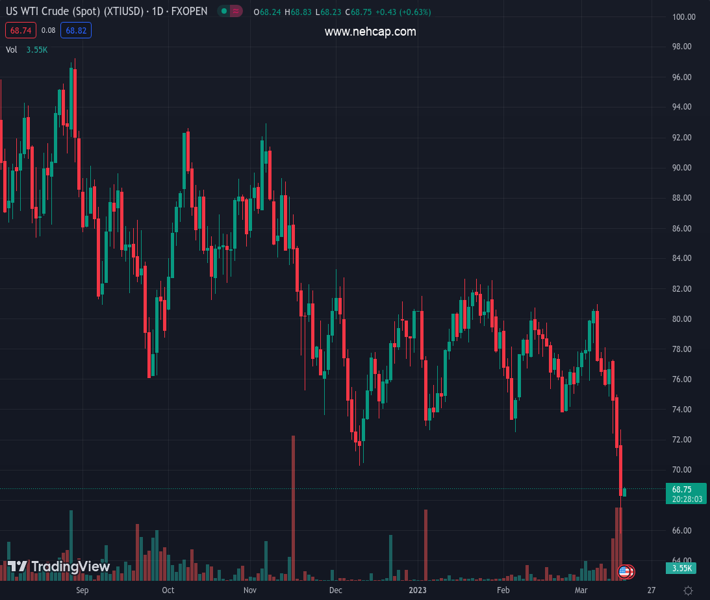
The pair currently trades last at 68.72.
The previous day high was 72.69 while the previous day low was 65.81. The daily 38.2% Fib levels comes at 68.44, expected to provide support. Similarly, the daily 61.8% fib level is at 70.06, expected to provide resistance.
US crude prices ended the day down 5.2% at $68.20 a barrel, the lowest closing price since Dec. 3, 2021 and the largest one-day percentage decline in more than two months on a wave of technical selling.
Credit Suisse’s 2022 annual report was published on Tuesday and it cited “material weaknesses” in its internal controls over financial reporting, noting that it had not yet stemmed customer outflows. This has provoked a flight to safety in financial markets, hurting the oil price.
Analysts at ANZ Bank said financial institutions were dumping crude futures to limit their exposure to falling prices in the options market. ´´This comes amid renewed fears of weakness in the physical market. The International Energy Agency warned that higher-than-expected Russia exports will keep the market in surplus for the first half of the year,´´ the analysts explained. ´´The Paris-based group highlighted that oil inventories have climbed to their highest levels in 18 months as demand growth remains subdued amid lingering fears of a recession.´´
Meanwhile, Russia Energy Ministry warned that its likely to lower its oil output in 2023, the analysts noted. ´´In the US, crude oil inventories jumped by 1.55mbbls last week. However, there were signs of stronger demand. Stockpiles of gasoline and distillate fell last week by 2,061kbbls and 2,537kbbls respectively.´´
Technical Levels: Supports and Resistances
XTIUSD currently trading at 68.72 at the time of writing. Pair opened at 68.41 and is trading with a change of 0.45 % .
| Overview | Overview.1 | |
|---|---|---|
| 0 | Today last price | 68.72 |
| 1 | Today Daily Change | 0.31 |
| 2 | Today Daily Change % | 0.45 |
| 3 | Today daily open | 68.41 |
The pair remains strongly bearish on the daily time frame. It trades below the 20 SMA @ 76.24, 50 SMA 77.5, 100 SMA @ 79.0 and 200 SMA @ 86.09.
| Trends | Trends.1 | |
|---|---|---|
| 0 | Daily SMA20 | 76.24 |
| 1 | Daily SMA50 | 77.50 |
| 2 | Daily SMA100 | 79.00 |
| 3 | Daily SMA200 | 86.09 |
The previous day high was 72.69 while the previous day low was 65.81. The daily 38.2% Fib levels comes at 68.44, expected to provide support. Similarly, the daily 61.8% fib level is at 70.06, expected to provide resistance.
Note the levels of interest below:
- Pivot support is noted at 65.25, 62.09, 58.37
- Pivot resistance is noted at 72.13, 75.85, 79.01
| Levels | Levels.1 |
|---|---|
| Previous Daily High | 72.69 |
| Previous Daily Low | 65.81 |
| Previous Weekly High | 80.99 |
| Previous Weekly Low | 74.89 |
| Previous Monthly High | 80.75 |
| Previous Monthly Low | 72.50 |
| Daily Fibonacci 38.2% | 68.44 |
| Daily Fibonacci 61.8% | 70.06 |
| Daily Pivot Point S1 | 65.25 |
| Daily Pivot Point S2 | 62.09 |
| Daily Pivot Point S3 | 58.37 |
| Daily Pivot Point R1 | 72.13 |
| Daily Pivot Point R2 | 75.85 |
| Daily Pivot Point R3 | 79.01 |
[/s2If]
Join Our Telegram Group
")


