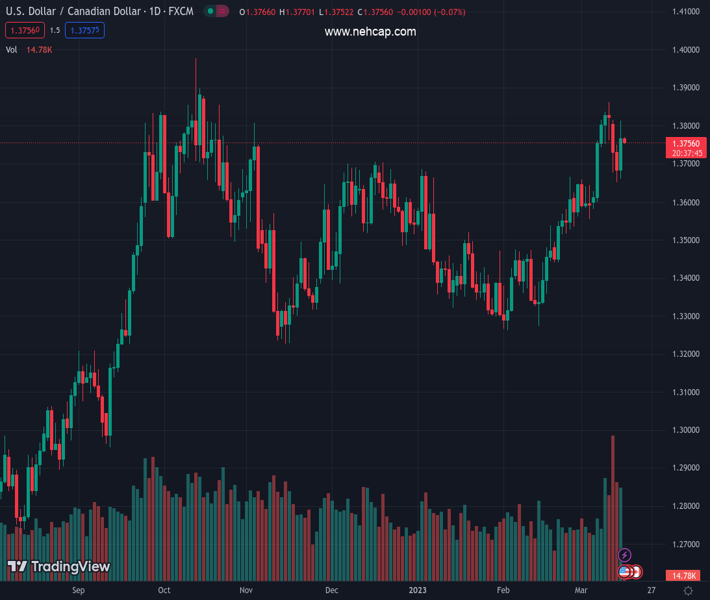
#USDCAD @ 1.37543 Credit Suisse-led oil weakness sent to the 1.3800 level. (Pivot Orderbook analysis)
…
This is a premium post.
[s2If !current_user_can(access_s2member_level4)]Please register for PREMIUM VERSION HERE to read full post below containing analysis. In case of any error or you think you are not able to read the full post below, please email us at support#nehcap.com [lwa][/s2If] [s2If current_user_can(access_s2member_level4)]
- Credit Suisse-led oil weakness sent USD/CAD to the 1.3800 level.
- WTI dips below the $70 mark as financial turmoil weighs on risk assets.
- Rumor around some emergency meetings among central banks.
The pair currently trades last at 1.37543.
The previous day high was 1.375 while the previous day low was 1.3652. The daily 38.2% Fib levels comes at 1.3689, expected to provide support. Similarly, the daily 61.8% fib level is at 1.3713, expected to provide support.
USD/CAD took a wild ride on Wednesday due to oil weakness. The pair touched the 1.3800 resistance as renewed price pressure affected oil prices. It all started with some floating rumors about Credit Suisse bank, which was perceived as a contagion effect following Silicon Valley Bank’s (SVB) fallout. There were some threats attributed to Credit Suisse that might have been tangled up with SVB’s financial crisis and could be the next liquidity victim, although all allegations have been denied by Credit Suisse’s CEO. Later on, the Swiss banking regulator intervened and committed to providing liquidity solutions if required.
The aforementioned situation triggered a fresh wave of sell-offs among risky assets, and oil prices were affected the most. West Texas Intermediate (WTI) price fell below the $70 mark as panic was triggered among investors. The falling oil prices have been signaling “something to break” on surging borrowing costs since cracks began to appear in financial systems.
A corrective downturn in oil prices that started earlier this week has weakened the Canadian Dollar and given a boost to USD/CAD. Although falling US Treasury yields are keeping a lid on any appreciation in the US Dollar, the pair is mainly driven by oil prices rather than anything else. Since the Bank of Canada took a pause on the rate hiking cycle, USD/CAD is more likely to be driven by either US Dollar dynamics or oil’s story.
Meanwhile, the US released its Retail Sales figures and Producer Price Index (PPI) data for February on Wednesday. The Retail Sales came in at a relatively massive downbeat; the MoM came in at -0.4% from the previous 3.2%, and the Control Group came in at 0.5% from the previous 2.3%. The PPI data showed some relief signs: the MoM reading came in at -0.1% from the prior 0.3%, and the YoY reading came in at 4.6% from the prior 5.7%.
Technical Levels: Supports and Resistances
USDCAD currently trading at 1.3758 at the time of writing. Pair opened at 1.3685 and is trading with a change of 0.53 % .
| Overview | Overview.1 | |
|---|---|---|
| 0 | Today last price | 1.3758 |
| 1 | Today Daily Change | 0.0073 |
| 2 | Today Daily Change % | 0.5300 |
| 3 | Today daily open | 1.3685 |
The pair remains strongly bullish on the daily timeframe. It trades above its 20 SMA @ 1.3613, 50 SMA 1.3483, 100 SMA @ 1.3505 and 200 SMA @ 1.3324.
| Trends | Trends.1 | |
|---|---|---|
| 0 | Daily SMA20 | 1.3613 |
| 1 | Daily SMA50 | 1.3483 |
| 2 | Daily SMA100 | 1.3505 |
| 3 | Daily SMA200 | 1.3324 |
The previous day high was 1.375 while the previous day low was 1.3652. The daily 38.2% Fib levels comes at 1.3689, expected to provide support. Similarly, the daily 61.8% fib level is at 1.3713, expected to provide support.
Note the levels of interest below:
- Pivot support is noted at 1.3641, 1.3597, 1.3543
- Pivot resistance is noted at 1.374, 1.3794, 1.3838
| Levels | Levels.1 |
|---|---|
| Previous Daily High | 1.3750 |
| Previous Daily Low | 1.3652 |
| Previous Weekly High | 1.3862 |
| Previous Weekly Low | 1.3582 |
| Previous Monthly High | 1.3666 |
| Previous Monthly Low | 1.3262 |
| Daily Fibonacci 38.2% | 1.3689 |
| Daily Fibonacci 61.8% | 1.3713 |
| Daily Pivot Point S1 | 1.3641 |
| Daily Pivot Point S2 | 1.3597 |
| Daily Pivot Point S3 | 1.3543 |
| Daily Pivot Point R1 | 1.3740 |
| Daily Pivot Point R2 | 1.3794 |
| Daily Pivot Point R3 | 1.3838 |
[/s2If]
Join Our Telegram Group
")


