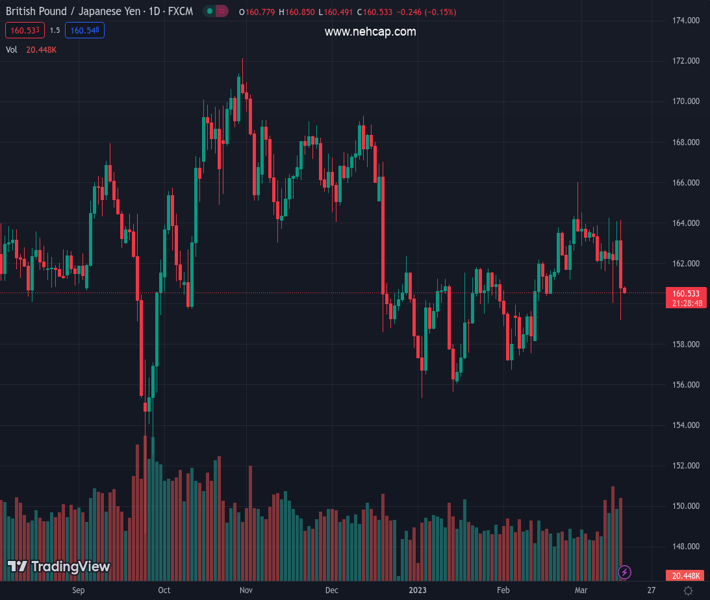
#GBPJPY @ 160.530 registered a bearish engulfing candle pattern but jumped off the weekly lows below 160.00. (Pivot Orderbook analysis)
…
This is a premium post.
[s2If !current_user_can(access_s2member_level4)]Please register for PREMIUM VERSION HERE to read full post below containing analysis. In case of any error or you think you are not able to read the full post below, please email us at support#nehcap.com [lwa][/s2If] [s2If current_user_can(access_s2member_level4)]
- GBP/JPY registered a bearish engulfing candle pattern but jumped off the weekly lows below 160.00.
- If the pair aims upwards, the GBP/JPY will face solid resistance around 161.70-90.
- Conversely, a GBP/JPY’s fall below 160.00 could pave the way toward 159.00.
The pair currently trades last at 160.530.
The previous day high was 164.09 while the previous day low was 161.87. The daily 38.2% Fib levels comes at 163.24, expected to provide resistance. Similarly, the daily 61.8% fib level is at 162.72, expected to provide resistance.
GBP/JPY collapsed on Wednesday and lost 1.43% due to a deterioration in market sentiment, sponsored by fears of a banking contagion after regulators seized two US banks. In the Europan session, Credit Suisse (CS) sell-off sent its CDS skyrocketing as odds for a default increased. However, Swiss authorities stepped in and cushioned the bank’s fall. Therefore, the GBP/JPY exchanges hands at 160.50, gaining a minuscule 0.03% in the Asian session.
After consolidating around the confluence of the 20, 50, 100, and 200-day Exponential Moving Averages (EMAs), the GBP/JPY distance from them, and edged towards a fresh 4-week low at 159.20. However, the GBP/JPY gained some traction late in the session and closed the day at 160.77.
Oscillators like the Relative Strength Index (RSI) are in bearish territory. However, the Rate of Change (RoC), showed that selling pressure eased toward the end of the trading day. Therefore, the path of least resistance is sideways.
Upwards, the GBP/JPY first resistance would be the 161.00 figure. Once the pair surges above that area, the confluence of the daily EMAs would be exposed, led by the 50 and 200-day EMAs, each at 161.75 and 161.94, respectively. Once cleared, the next stop would be the 20-day EMA at 162.00.
For a bearish continuation, the GBP/JPY needs to clear the March 13 low at 160.04 before posing a threat at the March 15 low at 159.20. Below that area looms the 159.00 figure.
Technical Levels: Supports and Resistances
GBPJPY currently trading at 160.57 at the time of writing. Pair opened at 163.18 and is trading with a change of -1.6 % .
| Overview | Overview.1 | |
|---|---|---|
| 0 | Today last price | 160.57 |
| 1 | Today Daily Change | -2.61 |
| 2 | Today Daily Change % | -1.60 |
| 3 | Today daily open | 163.18 |
The pair remains strongly bearish on the daily time frame. It trades below the 20 SMA @ 162.63, 50 SMA 160.78, 100 SMA @ 163.17 and 200 SMA @ 163.4.
| Trends | Trends.1 | |
|---|---|---|
| 0 | Daily SMA20 | 162.63 |
| 1 | Daily SMA50 | 160.78 |
| 2 | Daily SMA100 | 163.17 |
| 3 | Daily SMA200 | 163.40 |
The previous day high was 164.09 while the previous day low was 161.87. The daily 38.2% Fib levels comes at 163.24, expected to provide resistance. Similarly, the daily 61.8% fib level is at 162.72, expected to provide resistance.
Note the levels of interest below:
- Pivot support is noted at 162.0, 160.83, 159.78
- Pivot resistance is noted at 164.22, 165.27, 166.44
| Levels | Levels.1 |
|---|---|
| Previous Daily High | 164.09 |
| Previous Daily Low | 161.87 |
| Previous Weekly High | 164.26 |
| Previous Weekly Low | 161.62 |
| Previous Monthly High | 166.01 |
| Previous Monthly Low | 156.73 |
| Daily Fibonacci 38.2% | 163.24 |
| Daily Fibonacci 61.8% | 162.72 |
| Daily Pivot Point S1 | 162.00 |
| Daily Pivot Point S2 | 160.83 |
| Daily Pivot Point S3 | 159.78 |
| Daily Pivot Point R1 | 164.22 |
| Daily Pivot Point R2 | 165.27 |
| Daily Pivot Point R3 | 166.44 |
[/s2If]
Join Our Telegram Group
")


