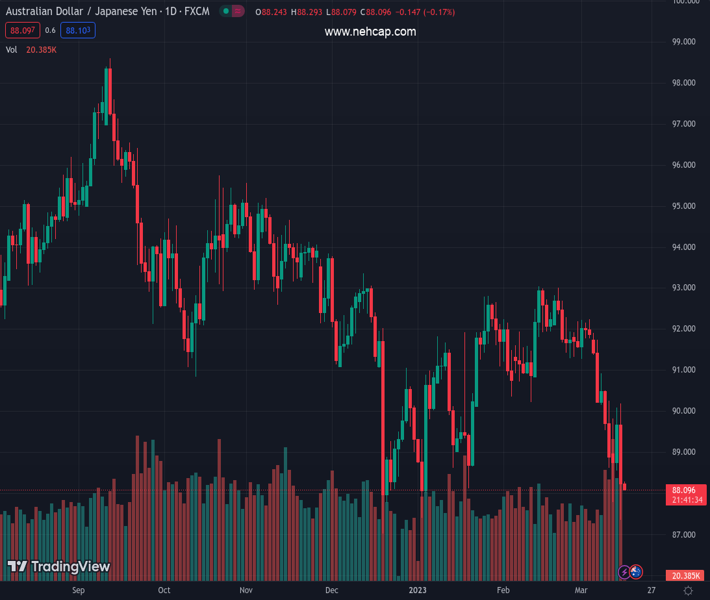
#AUDJPY @ 88.1580 dipped below 88.00 and reached a YTD low at 87.35 on Wednesday. (Pivot Orderbook analysis)
…
This is a premium post.
[s2If !current_user_can(access_s2member_level4)]Please register for PREMIUM VERSION HERE to read full post below containing analysis. In case of any error or you think you are not able to read the full post below, please email us at support#nehcap.com [lwa][/s2If] [s2If current_user_can(access_s2member_level4)]
- AUD/JPY dipped below 88.00 and reached a YTD low at 87.35 on Wednesday.
- The cross-currency pair bias remains downwards, albeit reclaiming the 88.00 figure.
- AUD/JPY Price Analysis: Downward biased, though once 89.00 is reclaimed, a leg-up to 90.00 is on the cards.
The pair currently trades last at 88.1580.
The previous day high was 90.1 while the previous day low was 88.55. The daily 38.2% Fib levels comes at 89.51, expected to provide resistance. Similarly, the daily 61.8% fib level is at 89.14, expected to provide resistance.
The AUD/JPY tumbled sharply on Wednesday, more than 1.50%, spurred by a risk-off impulse. Fears around global bank contagion weighed on global bank stocks, particularly Credit Suisse (CS), which seeks support from Swiss authorities like FINMA and the Swiss National Bank (SNB). At the time of writing, the AUD/JPY exchanges hands at $88.19.
After breaking a four-month-old upslope trendline, the AUD/JPY has fallen to new YTD lows reached on March 15 at 87.35. However, news from Switzerland sponsored a bounce off the lows, and the AUD/JPY pair closed above the 88.00 figure.
Oscillators remain bearish territory, but the Relative Strength Index (RSI) shifted flat, meaning consolidation lies ahead. In the meantime, the Rate of Change (RoC) portrays selling pressure as waning.
The AUD/JPY path of least resistance is downwards. Backed by the daily EMAs resting above the exchange rate and oscillators in bearish territory. Therefore, the AUD/JPY’s first support would be the 88.00 figure. Once broken, the pair might test the YTD lows at 87.35, which, once cleared, the AUD/JPY would dive towards the December 20 swing low at 87.01, ahead of the figure.
As an alternate scenario, the AUD/JPY first resistance would be 89.00. A surge above the figure and the AUD/JPY could rally towards 90.00, ahead of testing the 20-day EMA at 90.30.
Technical Levels: Supports and Resistances
AUDJPY currently trading at 88.24 at the time of writing. Pair opened at 89.7 and is trading with a change of -1.63 % .
| Overview | Overview.1 | |
|---|---|---|
| 0 | Today last price | 88.24 |
| 1 | Today Daily Change | -1.46 |
| 2 | Today Daily Change % | -1.63 |
| 3 | Today daily open | 89.70 |
The pair remains strongly bearish on the daily time frame. It trades below the 20 SMA @ 91.32, 50 SMA 91.15, 100 SMA @ 91.8 and 200 SMA @ 93.01.
| Trends | Trends.1 | |
|---|---|---|
| 0 | Daily SMA20 | 91.32 |
| 1 | Daily SMA50 | 91.15 |
| 2 | Daily SMA100 | 91.80 |
| 3 | Daily SMA200 | 93.01 |
The previous day high was 90.1 while the previous day low was 88.55. The daily 38.2% Fib levels comes at 89.51, expected to provide resistance. Similarly, the daily 61.8% fib level is at 89.14, expected to provide resistance.
Note the levels of interest below:
- Pivot support is noted at 88.8, 87.9, 87.24
- Pivot resistance is noted at 90.35, 91.0, 91.9
| Levels | Levels.1 |
|---|---|
| Previous Daily High | 90.10 |
| Previous Daily Low | 88.55 |
| Previous Weekly High | 91.95 |
| Previous Weekly Low | 88.63 |
| Previous Monthly High | 93.06 |
| Previous Monthly Low | 90.24 |
| Daily Fibonacci 38.2% | 89.51 |
| Daily Fibonacci 61.8% | 89.14 |
| Daily Pivot Point S1 | 88.80 |
| Daily Pivot Point S2 | 87.90 |
| Daily Pivot Point S3 | 87.24 |
| Daily Pivot Point R1 | 90.35 |
| Daily Pivot Point R2 | 91.00 |
| Daily Pivot Point R3 | 91.90 |
[/s2If]
Join Our Telegram Group
")


