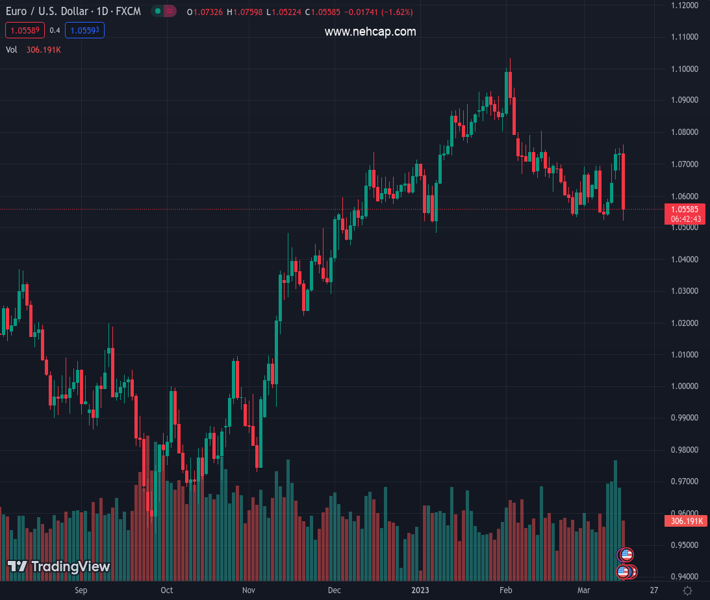
#EURUSD @ 1.05595 melts down and revisits the area of multi-week lows. (Pivot Orderbook analysis)
…
This is a premium post.
[s2If !current_user_can(access_s2member_level4)]Please register for PREMIUM VERSION HERE to read full post below containing analysis. In case of any error or you think you are not able to read the full post below, please email us at support#nehcap.com [lwa][/s2If] [s2If current_user_can(access_s2member_level4)]
- EUR/USD melts down and revisits the area of multi-week lows.
- A deeper drop to the 2023 low should not be ruled out now.
The pair currently trades last at 1.05595.
The previous day high was 1.075 while the previous day low was 1.0679. The daily 38.2% Fib levels comes at 1.0723, expected to provide resistance. Similarly, the daily 61.8% fib level is at 1.0706, expected to provide resistance.
EUR/USD comes under heavy selling pressure and fully reverses last week’s strong rebound, revisiting at the same time the 1.0520 area on Wednesday.
The pronounced sell-off carries the potential to retest the 2023 low near 1.0480 (January 6) ahead of the key 200-day SMA, today at 1.0323.
Looking at the longer run, the constructive view remains unchanged while above the 200-day SMA.
Technical Levels: Supports and Resistances
EURUSD currently trading at 1.0545 at the time of writing. Pair opened at 1.0733 and is trading with a change of -1.75 % .
| Overview | Overview.1 | |
|---|---|---|
| 0 | Today last price | 1.0545 |
| 1 | Today Daily Change | 237.0000 |
| 2 | Today Daily Change % | -1.7500 |
| 3 | Today daily open | 1.0733 |
The pair is trading below its 20 Daily moving average @ 1.0634, below its 50 Daily moving average @ 1.0727 , below its 100 Daily moving average @ 1.0551 and above its 200 Daily moving average @ 1.0326
| Trends | Trends.1 | |
|---|---|---|
| 0 | Daily SMA20 | 1.0634 |
| 1 | Daily SMA50 | 1.0727 |
| 2 | Daily SMA100 | 1.0551 |
| 3 | Daily SMA200 | 1.0326 |
The previous day high was 1.075 while the previous day low was 1.0679. The daily 38.2% Fib levels comes at 1.0723, expected to provide resistance. Similarly, the daily 61.8% fib level is at 1.0706, expected to provide resistance.
Note the levels of interest below:
- Pivot support is noted at 1.0691, 1.065, 1.0621
- Pivot resistance is noted at 1.0762, 1.0791, 1.0833
| Levels | Levels.1 |
|---|---|
| Previous Daily High | 1.0750 |
| Previous Daily Low | 1.0679 |
| Previous Weekly High | 1.0701 |
| Previous Weekly Low | 1.0524 |
| Previous Monthly High | 1.1033 |
| Previous Monthly Low | 1.0533 |
| Daily Fibonacci 38.2% | 1.0723 |
| Daily Fibonacci 61.8% | 1.0706 |
| Daily Pivot Point S1 | 1.0691 |
| Daily Pivot Point S2 | 1.0650 |
| Daily Pivot Point S3 | 1.0621 |
| Daily Pivot Point R1 | 1.0762 |
| Daily Pivot Point R2 | 1.0791 |
| Daily Pivot Point R3 | 1.0833 |
[/s2If]
Join Our Telegram Group
")


