#NZDUSD @ 0.61965 finds floor around 0.6200 after US Retail Sales data (Pivot Orderbook analysis)
…
This is a premium post.
[s2If !current_user_can(access_s2member_level4)]Please register for PREMIUM VERSION HERE to read full post below containing analysis. In case of any error or you think you are not able to read the full post below, please email us at support#nehcap.com [lwa][/s2If] [s2If current_user_can(access_s2member_level4)]
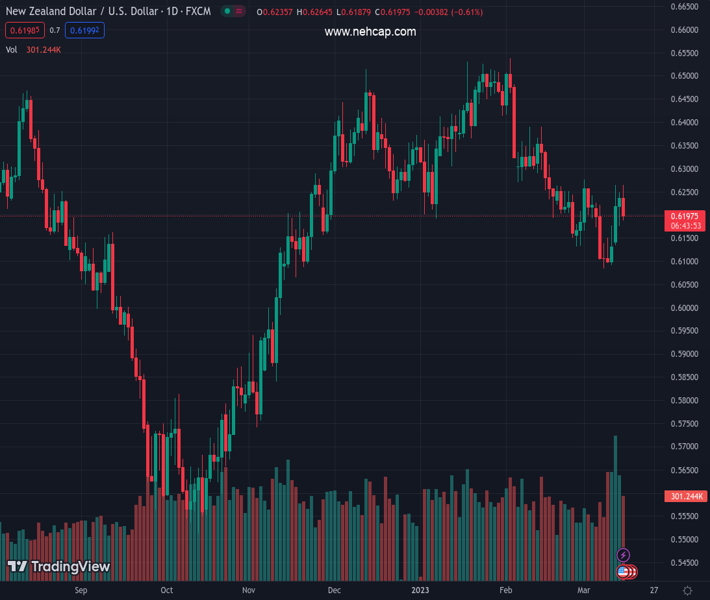
The pair currently trades last at 0.61965.
The previous day high was 0.6248 while the previous day low was 0.6198. The daily 38.2% Fib levels comes at 0.6229, expected to provide resistance. Similarly, the daily 61.8% fib level is at 0.6217, expected to provide resistance.
Daily price movements:
NZD/USD sees a bearish intraday movement on Wednesday, with the last recorded price at 0.6206 where it appears to be temporarily finding a floor. The currency pair started the session at 0.6235, and the overall intraday price change was -0.47% at press time.
New Zealand’s Gross Domestic Product (GDP) (QoQ & YoY for Q4) is to be released by Statistics New Zealand on Wednesday (21:45 GMT). It highlights the overall economic performance on a quarterly and yearly basis.
Already out is Retail Sales for February from the United States. This showed a fall of 0.4% MoM to $697.9 billion, according to data from the US Census Bureau report on Wednesday. This figure follows a 3.2% increase in January and was slightly below market expectations, which predicted a decline of 0.3%.
Following this data, the US Dollar Index (DXY) maintains its upward momentum, printing a 1.30% increase on the day, trading above 104.90 at the press time. A relatively more substantial DXY pressures the NZD/USD currency pair ahead of New Zealand’s GDP data releases on Wednesday at 21:45 GMT.
The NZD/USD pair trades just below its daily 20-SMA (0.6195) and significantly below its 50-SMA (0.6313), indicating a bearish bias in short to medium term.
The daily RSI(14) of 47.057 suggests a nearly neutral momentum as the pair trades close to the 50 mark. However, the market may encounter some resistance, as the daily resistance levels are at 0.6257, 0.6278, and 0.6308.
The daily pivot point for the NZD/USD pair is 0.6228, slightly above the last intraday price at press time. The daily support levels are found at 0.6207, 0.6177, and 0.6157. If the pair manages to break above the pivot point, it may test the resistance levels, while a break below the pivot point could trigger a test of the support levels.
Technical Levels: Supports and Resistances
NZDUSD currently trading at 0.6194 at the time of writing. Pair opened at 0.6237 and is trading with a change of -0.69 % .
| Overview | Overview.1 | |
|---|---|---|
| 0 | Today last price | 0.6194 |
| 1 | Today Daily Change | -0.0043 |
| 2 | Today Daily Change % | -0.6900 |
| 3 | Today daily open | 0.6237 |
The pair is trading below its 20 Daily moving average @ 0.6201, below its 50 Daily moving average @ 0.6317 , below its 100 Daily moving average @ 0.625 and above its 200 Daily moving average @ 0.6165
| Trends | Trends.1 | |
|---|---|---|
| 0 | Daily SMA20 | 0.6201 |
| 1 | Daily SMA50 | 0.6317 |
| 2 | Daily SMA100 | 0.6250 |
| 3 | Daily SMA200 | 0.6165 |
The previous day high was 0.6248 while the previous day low was 0.6198. The daily 38.2% Fib levels comes at 0.6229, expected to provide resistance. Similarly, the daily 61.8% fib level is at 0.6217, expected to provide resistance.
Note the levels of interest below:
- Pivot support is noted at 0.6207, 0.6177, 0.6157
- Pivot resistance is noted at 0.6257, 0.6278, 0.6308
| Levels | Levels.1 |
|---|---|
| Previous Daily High | 0.6248 |
| Previous Daily Low | 0.6198 |
| Previous Weekly High | 0.6226 |
| Previous Weekly Low | 0.6084 |
| Previous Monthly High | 0.6538 |
| Previous Monthly Low | 0.6131 |
| Daily Fibonacci 38.2% | 0.6229 |
| Daily Fibonacci 61.8% | 0.6217 |
| Daily Pivot Point S1 | 0.6207 |
| Daily Pivot Point S2 | 0.6177 |
| Daily Pivot Point S3 | 0.6157 |
| Daily Pivot Point R1 | 0.6257 |
| Daily Pivot Point R2 | 0.6278 |
| Daily Pivot Point R3 | 0.6308 |
[/s2If]
Join Our Telegram Group
")


