DXY regains unusually strong upside traction and targets 105.00. (Pivot Orderbook analysis)
…
This is a premium post.
[s2If !current_user_can(access_s2member_level4)]Please register for PREMIUM VERSION HERE to read full post below containing analysis. In case of any error or you think you are not able to read the full post below, please email us at support#nehcap.com [lwa][/s2If] [s2If current_user_can(access_s2member_level4)]
- DXY regains unusually strong upside traction and targets 105.00.
- The 100-day SMA at 104.95 emerges as the initial hurdle.
The pair currently trades last at 104.82.
The previous day high was 104.06 while the previous day low was 103.5. The daily 38.2% Fib levels comes at 103.85, expected to provide support. Similarly, the daily 61.8% fib level is at 103.71, expected to provide support.
DXY gathers intense buying interest and climbs to 3-day highs near the 105.00 region on Tuesday, an area also underpinned by the temporary 100-day SMA.
The continuation of the strong rebound is expected to challenge the so far 2023 high at 105.88 (March 8) prior to the key 200-day SMA, today at 106.64.
Looking at the broader picture, while below the 200-day SMA, the outlook for the greenback is expected to remain negative.
Technical Levels: Supports and Resistances
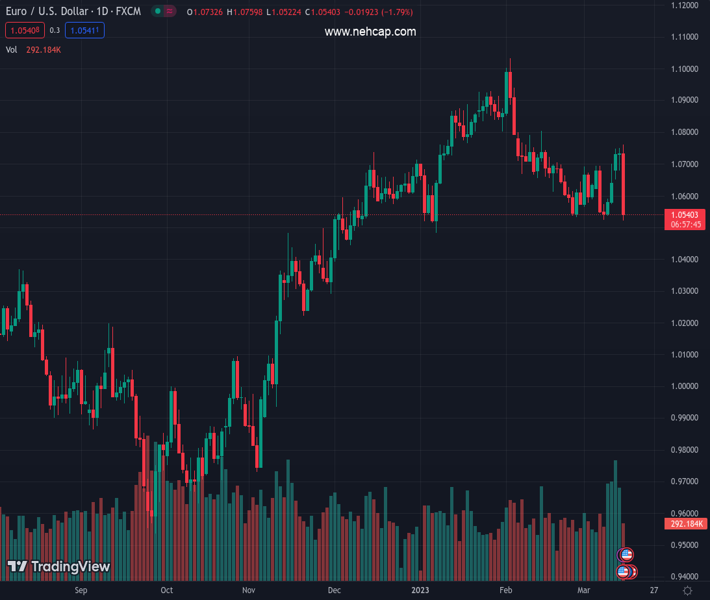
EURUSD currently trading at 104.82 at the time of writing. Pair opened at 103.67 and is trading with a change of 1.11 % .
| Overview | Overview.1 | |
|---|---|---|
| 0 | Today last price | 104.82 |
| 1 | Today Daily Change | 151.00 |
| 2 | Today Daily Change % | 1.11 |
| 3 | Today daily open | 103.67 |
The pair is trading above its 20 Daily moving average @ 104.53, above its 50 Daily moving average @ 103.45 , above its 100 Daily moving average @ 104.49 and below its 200 Daily moving average @ 106.84
| Trends | Trends.1 | |
|---|---|---|
| 0 | Daily SMA20 | 104.53 |
| 1 | Daily SMA50 | 103.45 |
| 2 | Daily SMA100 | 104.49 |
| 3 | Daily SMA200 | 106.84 |
The previous day high was 104.06 while the previous day low was 103.5. The daily 38.2% Fib levels comes at 103.85, expected to provide support. Similarly, the daily 61.8% fib level is at 103.71, expected to provide support.
Note the levels of interest below:
- Pivot support is noted at 103.43, 103.18, 102.87
- Pivot resistance is noted at 103.99, 104.3, 104.55
| Levels | Levels.1 |
|---|---|
| Previous Daily High | 104.06 |
| Previous Daily Low | 103.50 |
| Previous Weekly High | 105.89 |
| Previous Weekly Low | 104.05 |
| Previous Monthly High | 105.36 |
| Previous Monthly Low | 100.81 |
| Daily Fibonacci 38.2% | 103.85 |
| Daily Fibonacci 61.8% | 103.71 |
| Daily Pivot Point S1 | 103.43 |
| Daily Pivot Point S2 | 103.18 |
| Daily Pivot Point S3 | 102.87 |
| Daily Pivot Point R1 | 103.99 |
| Daily Pivot Point R2 | 104.30 |
| Daily Pivot Point R3 | 104.55 |
[/s2If]
Join Our Telegram Group
")


