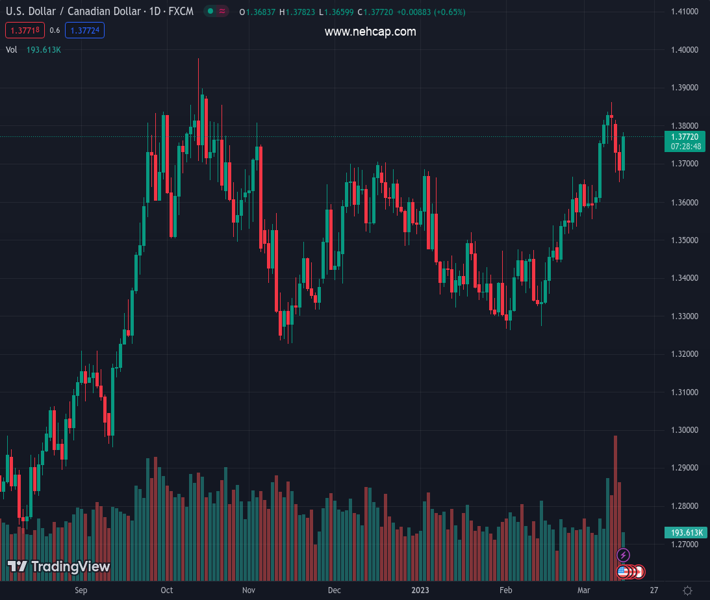
#USDCAD @ 1.37699 gains strong traction on Wednesday and draws support from a combination of factors. (Pivot Orderbook analysis)
…
This is a premium post.
[s2If !current_user_can(access_s2member_level4)]Please register for PREMIUM VERSION HERE to read full post below containing analysis. In case of any error or you think you are not able to read the full post below, please email us at support#nehcap.com [lwa][/s2If] [s2If current_user_can(access_s2member_level4)]
- USD/CAD gains strong traction on Wednesday and draws support from a combination of factors.
- A fresh wave of the global risk-aversion trade, hawkish Fed expectations underpin the Greenback.
- A slump in Oil prices weighs heavily on the Loonie and remains supportive of the strong move up.
The pair currently trades last at 1.37699.
The previous day high was 1.375 while the previous day low was 1.3652. The daily 38.2% Fib levels comes at 1.3689, expected to provide support. Similarly, the daily 61.8% fib level is at 1.3713, expected to provide support.
The USD/CAD pair attracts fresh buying near the 1.3660 region on Wednesday and snaps a three-day losing streak to a one-week low touched the previous day. The pair maintains its bid tone through the early North American session and is currently placed around the 1.3755-1.3760 area, just a few pips below the daily peak touched in the last hour.
A combination of supporting factors provides a strong boost to the US Dollar, which, in turn, is seen as a key factor acting as a tailwind for the USD/CAD pair. The US CPI report released on Tuesday indicated that inflation isn’t coming down quite as fast as hoped and revived bets for at least a 25 bps rate hike by the Federal Reserve at its policy meeting on March 21-22. Apart from this, a fresh wave of the global risk-aversion trade, led by negative news surrounding the Swiss lender Credit Suisse, further benefits the Greenback’s relative safe-haven status.
In fact, the top shareholder of the troubled Swiss bank said that it can’t pump in any more money as a bigger holding would bring additional regulatory hurdles, fueling speculations that the bank will eventually default. This, in turn, triggered a massive sell-off across the global equity markets, which, to a larger extent, helps offset the mostly disappointing US macro data and continues to underpin the buck. the US Producer Price Index (PPI) unexpectedly declined by 0.1% in February and the yearly rate decelerated more than anticipated, to 4.6% from 5.7% in January.
Furthermore, the core PPI, which excludes food and energy prices, remained flat during the reported month and fell to a 4.4% YoY rate from 5.4% recorded in the previous month. Separately, the US monthly Retail Sales fell by 0.4% in February as compared to the strong 3.2% rise recorded in the previous month and the 0.3% decline expected. Adding to this, the New York Fed’s Empire State Manufacturing Index plummets to -24.6 for the current month, missing estimates for a fall to -8 from the -5.8 previous, though does little to dent the intraday bullish sentiment around the USD.
Apart from this, a steep downfall in Crude Oil prices, to the lowest level since December 2021, is seen weighing heavily on the commodity-linked Loonie and extends additional support to the USD/CAD pair. This, along with the fact that the Bank of Canada (BoC) became the first major central bank to pause its rate-hiking cycle last week, suggests that the path of least resistance for spot prices is to the upside. Hence, a subsequent strength towards the 1.3800 mark, en route to the multi-month peak, around the 1.3860 touched earlier this March, looks like a distinct possibility.
Technical Levels: Supports and Resistances
USDCAD currently trading at 1.375 at the time of writing. Pair opened at 1.3685 and is trading with a change of 0.47 % .
| Overview | Overview.1 | |
|---|---|---|
| 0 | Today last price | 1.3750 |
| 1 | Today Daily Change | 0.0065 |
| 2 | Today Daily Change % | 0.4700 |
| 3 | Today daily open | 1.3685 |
The pair remains strongly bullish on the daily timeframe. It trades above its 20 SMA @ 1.3613, 50 SMA 1.3483, 100 SMA @ 1.3505 and 200 SMA @ 1.3324.
| Trends | Trends.1 | |
|---|---|---|
| 0 | Daily SMA20 | 1.3613 |
| 1 | Daily SMA50 | 1.3483 |
| 2 | Daily SMA100 | 1.3505 |
| 3 | Daily SMA200 | 1.3324 |
The previous day high was 1.375 while the previous day low was 1.3652. The daily 38.2% Fib levels comes at 1.3689, expected to provide support. Similarly, the daily 61.8% fib level is at 1.3713, expected to provide support.
Note the levels of interest below:
- Pivot support is noted at 1.3641, 1.3597, 1.3543
- Pivot resistance is noted at 1.374, 1.3794, 1.3838
| Levels | Levels.1 |
|---|---|
| Previous Daily High | 1.3750 |
| Previous Daily Low | 1.3652 |
| Previous Weekly High | 1.3862 |
| Previous Weekly Low | 1.3582 |
| Previous Monthly High | 1.3666 |
| Previous Monthly Low | 1.3262 |
| Daily Fibonacci 38.2% | 1.3689 |
| Daily Fibonacci 61.8% | 1.3713 |
| Daily Pivot Point S1 | 1.3641 |
| Daily Pivot Point S2 | 1.3597 |
| Daily Pivot Point S3 | 1.3543 |
| Daily Pivot Point R1 | 1.3740 |
| Daily Pivot Point R2 | 1.3794 |
| Daily Pivot Point R3 | 1.3838 |
[/s2If]
Join Our Telegram Group
")


