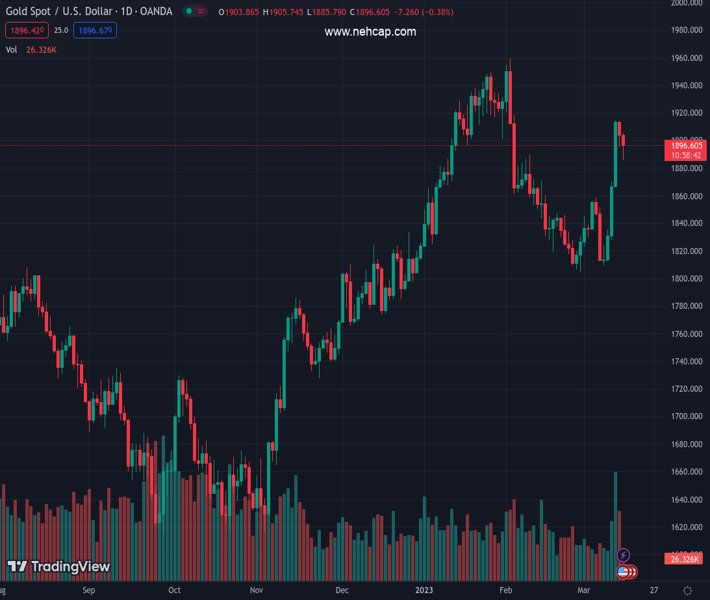
#XAUUSD @ 1,896.68 Gold price drifts lower for the second straight day and retreats further from a multi-week high. (Pivot Orderbook analysis)
…
This is a premium post.
[s2If !current_user_can(access_s2member_level4)]Please register for PREMIUM VERSION HERE to read full post below containing analysis. In case of any error or you think you are not able to read the full post below, please email us at support#nehcap.com [lwa][/s2If] [s2If current_user_can(access_s2member_level4)]
- Gold price drifts lower for the second straight day and retreats further from a multi-week high.
- Bets for additional rate hikes by major central banks weigh on the non-yielding yellow metal.
- Rallying US bond yields underpins the US Dollar and further contributes to the selling pressure.
The pair currently trades last at 1896.68.
The previous day high was 1914.32 while the previous day low was 1895.43. The daily 38.2% Fib levels comes at 1902.65, expected to provide resistance. Similarly, the daily 61.8% fib level is at 1907.1, expected to provide resistance.
Gold price remains under some selling pressure for the second straight day on Wednesday and extends the overnight pullback from the $1,914-$1,915 area, or its highest level since early February. The intraday downfall remains uninterrupted through the first half of the European session and drags the XAU/USD to a two-day low, around the $1,885 region in the last hour.
Despite concerns over a banking crisis in the United States (US), investors seem convinced that the Federal Reserve (Fed) might still go ahead with a smaller 25 basis point (bps) rate hike at its upcoming policy meeting on March 21-22. The bets were lifted by the latest US Consumer Price Index (CPI) report released on Tuesday, which showed that inflation isn’t coming down quite as fast as hoped. This, in turn, is seen as a key factor weighing on the non-yielding Gold price.
The prospect for further policy tightening by the Fed is reinforced by the ongoing rally in the US Treasury bond yields, which, in turn, lends support to the US Dollar (USD). This further contributes to driving flows away from the non-yielding Gold price. Apart from this, a generally positive risk tone, amid easing fears about a broader systemic crisis from the sudden collapse of Silicon Valley Bank (SVB), is seen denting demand for the safe-haven precious metal.
The markets, meanwhile, have been pricing in the possibility of additional jumbo interest rate hikes by the European Central Bank (ECB) beyond the March meeting, due on Thursday. Moreover, the Bank of England (BoE) is also anticipated to stick to its rate-hiking cycle next week. This, in turn, suggests that the recent recovery in Gold prices from the vicinity of the 100-day Simple Moving Average (SMA) might have run its course and favours bearish traders.
That said, it will still be prudent to wait for some follow-through selling below the $1,880 resistance breakpoint turned support before positioning for any further losses. Traders now look to the US economic docket, featuring the release of the Producer Price Index (PPI), monthly Retail Sales figures and the Empire State Manufacturing Index. This, along with the US bond yields, the USD price dynamics and the broader risk sentiment, should provide a fresh impetus.
From a technical perspective, the aforementioned resistance-turned-support near the $1,880 level should protect the immediate downside for Gold price. A convincing break below might prompt some technical selling and drag the XAU/USD towards the next relevant support near the $1,856-$1,855 zone. Some follow-through selling will expose the 100-day SMA support, currently around the $1,817 region, which if broken decisively will be seen as a fresh trigger for bearish traders.
On the flip side, the weekly swing high, around the $1,914-$1,915 region, now seems to act as an immediate strong resistance. Bulls might now wait for a sustained move beyond the said barrier before positioning for the resumption of the recent upward trajectory witnessed over the past week or so. The Gold price might then accelerate the momentum towards retesting the ten-month peak, around the $1,959-$1,960 region touched in February.
Technical Levels: Supports and Resistances
XAUUSD currently trading at 1888.95 at the time of writing. Pair opened at 1904.16 and is trading with a change of -0.8 % .
| Overview | Overview.1 | |
|---|---|---|
| 0 | Today last price | 1888.95 |
| 1 | Today Daily Change | -15.21 |
| 2 | Today Daily Change % | -0.80 |
| 3 | Today daily open | 1904.16 |
The pair remains strongly bullish on the daily timeframe. It trades above its 20 SMA @ 1840.85, 50 SMA 1874.19, 100 SMA @ 1815.61 and 200 SMA @ 1775.68.
| Trends | Trends.1 | |
|---|---|---|
| 0 | Daily SMA20 | 1840.85 |
| 1 | Daily SMA50 | 1874.19 |
| 2 | Daily SMA100 | 1815.61 |
| 3 | Daily SMA200 | 1775.68 |
The previous day high was 1914.32 while the previous day low was 1895.43. The daily 38.2% Fib levels comes at 1902.65, expected to provide resistance. Similarly, the daily 61.8% fib level is at 1907.1, expected to provide resistance.
Note the levels of interest below:
- Pivot support is noted at 1894.95, 1885.75, 1876.06
- Pivot resistance is noted at 1913.84, 1923.53, 1932.73
| Levels | Levels.1 |
|---|---|
| Previous Daily High | 1914.32 |
| Previous Daily Low | 1895.43 |
| Previous Weekly High | 1870.09 |
| Previous Weekly Low | 1809.46 |
| Previous Monthly High | 1959.80 |
| Previous Monthly Low | 1804.76 |
| Daily Fibonacci 38.2% | 1902.65 |
| Daily Fibonacci 61.8% | 1907.10 |
| Daily Pivot Point S1 | 1894.95 |
| Daily Pivot Point S2 | 1885.75 |
| Daily Pivot Point S3 | 1876.06 |
| Daily Pivot Point R1 | 1913.84 |
| Daily Pivot Point R2 | 1923.53 |
| Daily Pivot Point R3 | 1932.73 |
[/s2If]
Join Our Telegram Group
")


