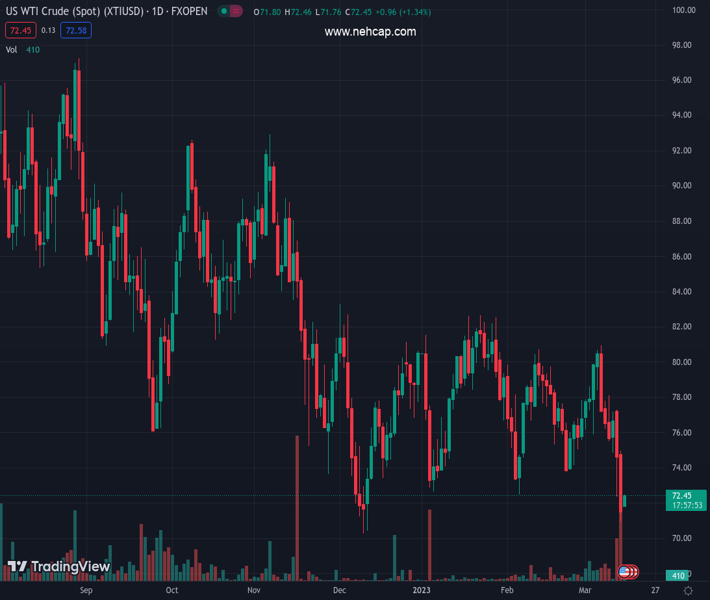
Oil price has gradually scaled to near $72.50, further upside looks capped ahead of oil inventory data. (Pivot Orderbook analysis)
…
This is a premium post.
[s2If !current_user_can(access_s2member_level4)]Please register for PREMIUM VERSION HERE to read full post below containing analysis. In case of any error or you think you are not able to read the full post below, please email us at support#nehcap.com [lwa][/s2If] [s2If current_user_can(access_s2member_level4)]
- Oil price has gradually scaled to near $72.50, further upside looks capped ahead of oil inventory data.
- A fresh monthly low by the USD Index at 103.44 has infused fresh blood into the oil price.
- Declining 20-period EMA and weak RSI (14) are indicating further downside for black gold.
The pair currently trades last at 72.52.
The previous day high was 75.01 while the previous day low was 70.93. The daily 38.2% Fib levels comes at 72.49, expected to provide support. Similarly, the daily 61.8% fib level is at 73.45, expected to provide resistance.
West Texas Intermediate (WTI), futures on NYMEX, had shown a recovery move from $71.00. The recovery move has gradually moved to near $72.26. Further upside in the oil price looks restricted as investors are still worried about global demand amid rising rates by western central banks.
The recovery move in the oil price is backed by a sell-off in the US Dollar Index (DXY). The USD Index has refreshed its monthly low at 103.44 as the declining US Consumer Price Index (CPI), higher Unemployment Rate, and the catastrophic collapse of Silicon Valley Bank (SVB) are compelling for a less hawkish interest rate hike from the Federal Reserve (Fed) in its monetary policy meeting scheduled for next week.
Going forward, the release of the weekly oil inventory data by the US Energy Information Administration (EIA) will be of utmost importance.
After a responsive buying move from March 14 low at $71.00, the oil price is challenging the critical resistance plotted from February 6 low at $72.60. It would be better to adopt a ‘wait and watch’ approach before making any position as the recovery move looks solid on the two-hour scale and carries the potential of delivering a breakout above the same.
The declining 20-period Exponential Moving Average (EMA) at $73.56 still favors the downside bias.
Adding to that, the Relative Strength Index (RSI) (14) is also oscillating in the bearish range of 20.00-40.00, which indicates that the downside momentum is not over yet.
Should the oil price decisively breaks above the 73.00 resistance, bulls will drive the asset toward March 10 low around $75.00 and March 12 high at $77.50.
Alternatively, a breakdown of March 14 low at $71.00 will expose the asset to a fresh 15-month low at $66.10, which is 20 December 2021 low followed by 30 November 2021 low at $64.40.
Technical Levels: Supports and Resistances
XTIUSD currently trading at 72.52 at the time of writing. Pair opened at 71.65 and is trading with a change of 1.21 % .
| Overview | Overview.1 | |
|---|---|---|
| 0 | Today last price | 72.52 |
| 1 | Today Daily Change | 0.87 |
| 2 | Today Daily Change % | 1.21 |
| 3 | Today daily open | 71.65 |
The pair remains strongly bearish on the daily time frame. It trades below the 20 SMA @ 76.76, 50 SMA 77.6, 100 SMA @ 79.2 and 200 SMA @ 86.35.
| Trends | Trends.1 | |
|---|---|---|
| 0 | Daily SMA20 | 76.76 |
| 1 | Daily SMA50 | 77.60 |
| 2 | Daily SMA100 | 79.20 |
| 3 | Daily SMA200 | 86.35 |
The previous day high was 75.01 while the previous day low was 70.93. The daily 38.2% Fib levels comes at 72.49, expected to provide support. Similarly, the daily 61.8% fib level is at 73.45, expected to provide resistance.
Note the levels of interest below:
- Pivot support is noted at 70.05, 68.45, 65.97
- Pivot resistance is noted at 74.13, 76.61, 78.21
| Levels | Levels.1 |
|---|---|
| Previous Daily High | 75.01 |
| Previous Daily Low | 70.93 |
| Previous Weekly High | 80.99 |
| Previous Weekly Low | 74.89 |
| Previous Monthly High | 80.75 |
| Previous Monthly Low | 72.50 |
| Daily Fibonacci 38.2% | 72.49 |
| Daily Fibonacci 61.8% | 73.45 |
| Daily Pivot Point S1 | 70.05 |
| Daily Pivot Point S2 | 68.45 |
| Daily Pivot Point S3 | 65.97 |
| Daily Pivot Point R1 | 74.13 |
| Daily Pivot Point R2 | 76.61 |
| Daily Pivot Point R3 | 78.21 |
[/s2If]
Join Our Telegram Group
")


