#AUDUSD @ 0.66793 retreats from intraday high, struggles to extend two-day uptrend., @nehcap view: Pullback expected (Pivot Orderbook analysis)
…
This is a premium post.
[s2If !current_user_can(access_s2member_level4)]Please register for PREMIUM VERSION HERE to read full post below containing analysis. In case of any error or you think you are not able to read the full post below, please email us at support#nehcap.com [lwa][/s2If] [s2If current_user_can(access_s2member_level4)]
- AUD/USD retreats from intraday high, struggles to extend two-day uptrend.
- Steady RSI, looming bull cross on MACD and multi-day-old descending resistance line challenge Aussie buyers.
- AUD/USD bears need validation from 61.8% Fibonacci retracement level; key DMA confluence adds to the upside filters.
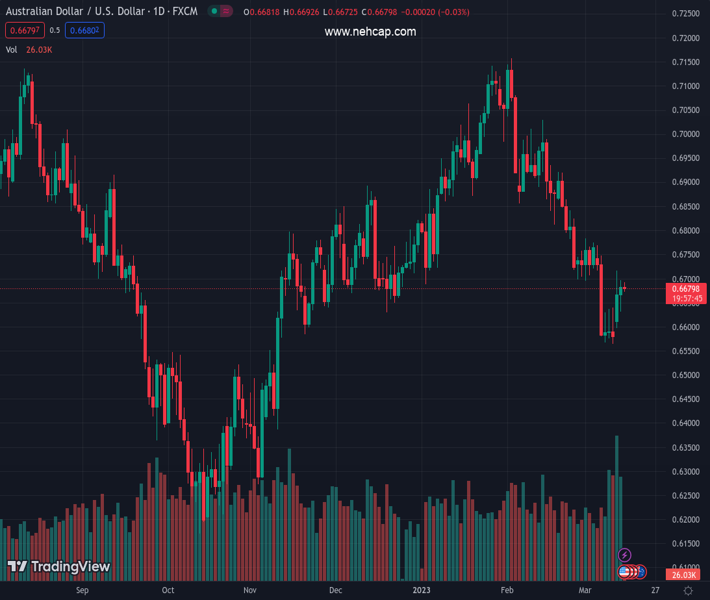
The pair currently trades last at 0.66793.
The previous day high was 0.6696 while the previous day low was 0.6632. The daily 38.2% Fib levels comes at 0.6671, expected to provide support. Similarly, the daily 61.8% fib level is at 0.6656, expected to provide support.
AUD/USD takes offers to 0.6680 as it drops towards refreshing the intraday low of 0.6671 during early Thursday. In doing so, the Aussie pair prints the first daily loss in three as the bulls flirt with a downward-sloping resistance line from early February.
In addition to the six-week-old descending resistance line, sluggish RSI (14) and indecisive MACD signals also challenge the AUD/USD pair buyers unless the quote stays below the 0.6700 trend line resistance.
Even if the Aussie pair crosses the 0.6700 round figure, a convergence of the 100-DMA and the 200-DMA, around .6770-75 at the latest, appears a tough nut to crack for the bulls.
In a case where the AUD/USD price remains firmer past 0.6775, the December 2022 high near 0.6895 and the 0.6900 round figure may act as the last defenses of the pair bears.
On the flip side, pullback remains elusive beyond the 50% Fibonacci retracement level of the risk-barometer pair’s upside from October 2022 to February 2023, close to 0.6655 by the press time.
Following that, the latest swing low and the 61.8% Fibonacci retracement level, also known as the golden Fibonacci ratio, respectively around 0.6565 and 0.6550 in that order, could probe the AUD/USD bears before giving them control.
Overall, AUD/USD is likely to witness a pullback as China data looms but the downside room appears limited.
Trend: Pullback expected
Technical Levels: Supports and Resistances
AUDUSD currently trading at 0.668 at the time of writing. Pair opened at 0.6683 and is trading with a change of -0.04% % .
| Overview | Overview.1 | |
|---|---|---|
| 0 | Today last price | 0.668 |
| 1 | Today Daily Change | -0.0003 |
| 2 | Today Daily Change % | -0.04% |
| 3 | Today daily open | 0.6683 |
The pair remains strongly bearish on the daily time frame. It trades below the 20 SMA @ 0.6747, 50 SMA 0.6881, 100 SMA @ 0.6771 and 200 SMA @ 0.6772.
| Trends | Trends.1 | |
|---|---|---|
| 0 | Daily SMA20 | 0.6747 |
| 1 | Daily SMA50 | 0.6881 |
| 2 | Daily SMA100 | 0.6771 |
| 3 | Daily SMA200 | 0.6772 |
The previous day high was 0.6696 while the previous day low was 0.6632. The daily 38.2% Fib levels comes at 0.6671, expected to provide support. Similarly, the daily 61.8% fib level is at 0.6656, expected to provide support.
Note the levels of interest below:
- Pivot support is noted at 0.6644, 0.6606, 0.658
- Pivot resistance is noted at 0.6709, 0.6735, 0.6773
| Levels | Levels.1 |
|---|---|
| Previous Daily High | 0.6696 |
| Previous Daily Low | 0.6632 |
| Previous Weekly High | 0.6770 |
| Previous Weekly Low | 0.6564 |
| Previous Monthly High | 0.7158 |
| Previous Monthly Low | 0.6698 |
| Daily Fibonacci 38.2% | 0.6671 |
| Daily Fibonacci 61.8% | 0.6656 |
| Daily Pivot Point S1 | 0.6644 |
| Daily Pivot Point S2 | 0.6606 |
| Daily Pivot Point S3 | 0.6580 |
| Daily Pivot Point R1 | 0.6709 |
| Daily Pivot Point R2 | 0.6735 |
| Daily Pivot Point R3 | 0.6773 |
[/s2If]
Join Our Telegram Group
")


