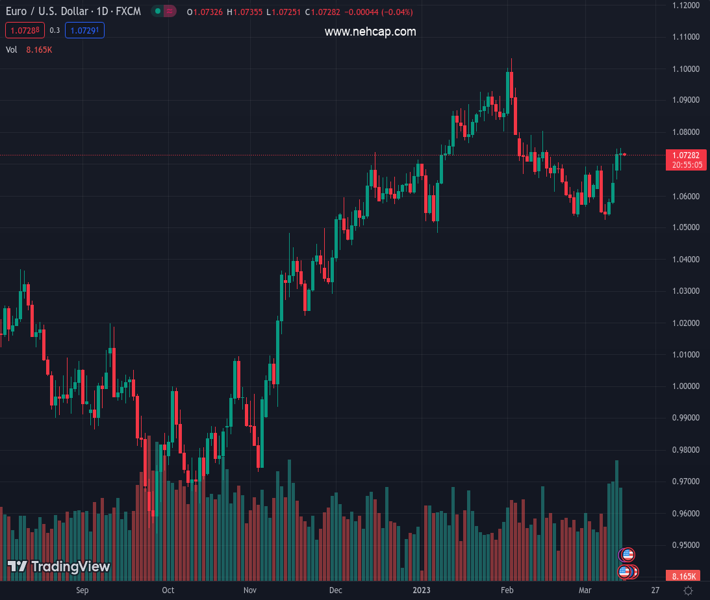
US Dollar Index picks up bids to extend the previous day’s U-turn from one-month low. (Pivot Orderbook analysis)
…
This is a premium post.
[s2If !current_user_can(access_s2member_level4)]Please register for PREMIUM VERSION HERE to read full post below containing analysis. In case of any error or you think you are not able to read the full post below, please email us at support#nehcap.com [lwa][/s2If] [s2If current_user_can(access_s2member_level4)]
- US Dollar Index picks up bids to extend the previous day’s U-turn from one-month low.
- Treasury bond yields remain sidelined after Tuesday’s notable rebound.
- US policymakers rule out challenges to the financial markets, economy due to SVB fallout.
- US inflation came in mixed but market’s bets on 25 bps Fed rate hike favor DXY bulls ahead of Retail Sales for February.
The pair currently trades last at 103.74.
The previous day high was 104.39 while the previous day low was 103.48. The daily 38.2% Fib levels comes at 103.83, expected to provide resistance. Similarly, the daily 61.8% fib level is at 104.05, expected to provide resistance.
US Dollar Index (DXY) renews intraday high near 103.75 as it stretches the previous day’s rebound from a one-month low to early Wednesday’s Asian session. In doing so, the greenback’s gauge versus the six major currencies cheers the receding fears from the latest fallouts of the Silicon Valley Bank (SVB) and Signature Bank ahead of the key US Retail Sales for February.
Recently, US Senate Banking Committee Chairman Sherrod Brown and Federal Reserve Governor Michelle Bowman ruled out chatters suggesting the grim conditions of the US banking industry.
Alternatively, Wall Street Journal (WSJ) reported that a raft of tougher capital and liquidity requirements are under review, as well as steps to beef up annual “stress tests” that assess banks’ ability to weather a hypothetical recession, according to a person familiar with the latest thinking among U.S. regulators. “The rules could target firms with between $100 billion to $250 billion in assets, which at present escape some of the toughest requirements,” per WSJ.
It should be noted, however, that the S&P 500 Futures refrain from welcoming the bears at the latest, suggesting an absence of the risk-off mood, after the Wall Street benchmarks rallied the previous day. Additionally, the US 10-year and two-year Treasury bond yields grind higher following the biggest daily run-up in more than a month.
On Tuesday, the US Consumer Price Index (CPI) and CPI ex Food and Energy both matched 6.0% and 5.5% YoY market forecasts, versus 6.4% and 5.6% respective previous readings. It should be noted that the market consensus of 0.4% MoM for the CPI, versus 0.5% prior, also proved right but the CPI ex Food & Energy rose to 0.5% compared to 0.4% analysts’ estimates and prior.
“The Federal Reserve is seen raising its benchmark rate a quarter of a percentage point next week and again in May, as a government report showed U.S. inflation remained high in February, and concerns of a long-lasting banking crisis eased,” said Reuters following the US inflation data release.
Looking ahead, today’s US Retail Sales for February, expected -0.3% MoM versus 3.0% prior, will be important to watch as the hawkish bets on the Federal Reserve’s (Fed) 25 basis points (bps) rate hike in the next week’s Federal Open Market Committee (FOMC) improve lately. Also important to watch will be the headlines conveying the market sentiment after the SVB fallout and the bond market moves.
An inverted hammer bullish candlestick on the daily chart, just above the 50-DMA support of 103.44, keeps the US Dollar Index (DXY) bulls hopeful.
Technical Levels: Supports and Resistances
EURUSD currently trading at 103.74 at the time of writing. Pair opened at 103.62 and is trading with a change of 0.12% % .
| Overview | Overview.1 | |
|---|---|---|
| 0 | Today last price | 103.74 |
| 1 | Today Daily Change | 0.12 |
| 2 | Today Daily Change % | 0.12% |
| 3 | Today daily open | 103.62 |
The pair is trading below its 20 Daily moving average @ 104.5, above its 50 Daily moving average @ 103.47 , below its 100 Daily moving average @ 104.55 and below its 200 Daily moving average @ 106.84
| Trends | Trends.1 | |
|---|---|---|
| 0 | Daily SMA20 | 104.50 |
| 1 | Daily SMA50 | 103.47 |
| 2 | Daily SMA100 | 104.55 |
| 3 | Daily SMA200 | 106.84 |
The previous day high was 104.39 while the previous day low was 103.48. The daily 38.2% Fib levels comes at 103.83, expected to provide resistance. Similarly, the daily 61.8% fib level is at 104.05, expected to provide resistance.
Note the levels of interest below:
- Pivot support is noted at 103.27, 102.92, 102.36
- Pivot resistance is noted at 104.18, 104.74, 105.09
| Levels | Levels.1 |
|---|---|
| Previous Daily High | 104.39 |
| Previous Daily Low | 103.48 |
| Previous Weekly High | 105.89 |
| Previous Weekly Low | 104.05 |
| Previous Monthly High | 105.36 |
| Previous Monthly Low | 100.81 |
| Daily Fibonacci 38.2% | 103.83 |
| Daily Fibonacci 61.8% | 104.05 |
| Daily Pivot Point S1 | 103.27 |
| Daily Pivot Point S2 | 102.92 |
| Daily Pivot Point S3 | 102.36 |
| Daily Pivot Point R1 | 104.18 |
| Daily Pivot Point R2 | 104.74 |
| Daily Pivot Point R3 | 105.09 |
[/s2If]
Join Our Telegram Group
")


