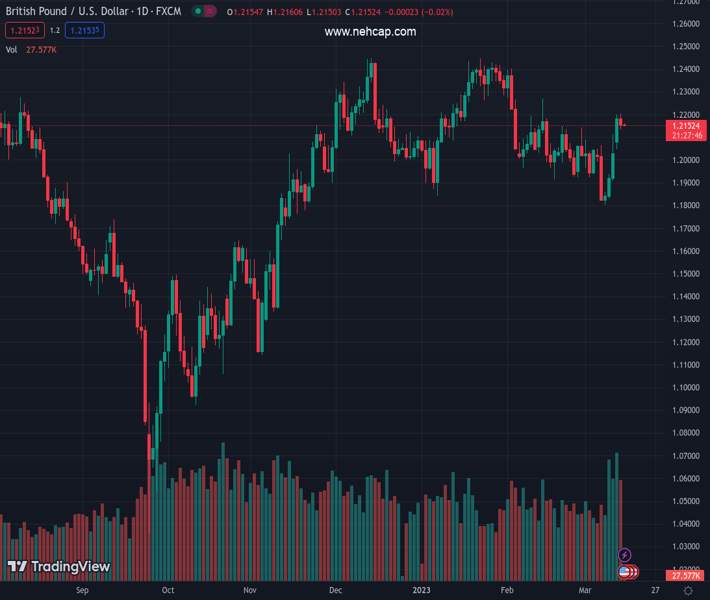
#GBPUSD @ 1.21523 remains pressured after reversing from one-month high., @nehcap view: Upside expected (Pivot Orderbook analysis)
…
This is a premium post.
[s2If !current_user_can(access_s2member_level4)]Please register for PREMIUM VERSION HERE to read full post below containing analysis. In case of any error or you think you are not able to read the full post below, please email us at support#nehcap.com [lwa][/s2If] [s2If current_user_can(access_s2member_level4)]
- GBP/USD remains pressured after reversing from one-month high.
- Convergence of 50-DMA, 23.6% Fibonacci retracement limits immediate downside.
- Bullish MACD signals, upbeat RSI (14) keeps buyers hopeful.
- UK Chancellor Hunt will deliver Budget speech in Parliament at 12:30 GMT.
The pair currently trades last at 1.21523.
The previous day high was 1.22 while the previous day low was 1.2032. The daily 38.2% Fib levels comes at 1.2136, expected to provide support. Similarly, the daily 61.8% fib level is at 1.2096, expected to provide support.
GBP/USD bears struggle to keep the reins, after entering the ring the previous day, as the quote stays depressed around 1.2160 during early Wednesday. In doing so, the Cable pair grinds near the short-term key support confluence as traders await the UK Finance Minister (Chancellor) Jeremy Hunt’s annual budget speech.
Also read: UK Chancellor Hunt, hemmed in by debt, set to focus on growth in British budget
Apart from the convergence of the 50-DMA and 23.6% Fibonacci retracement level of the GBP/USD pair’s upside from November 2022 to February 2023, around 1.2135, the bullish MACD signals and upbeat RSI (14), not overbought, also favor the Cable pair buyers.
Even if the quote breaks the 1.2135 support confluence, the resistance-turned-support line from mid-February, around 1.2005 at the latest, adds to the downside filters.
It’s worth noting that the GBP/USD bears need validation from the 50% Fibonacci retracement level surrounding 1.1800 to retake control. That said, lows marked during January and in the last week, respectively near 1.1840 and 1.1805, act as additional supports to watch during the quote’s further downside.
On the flip side, February’s top surrounding 1.2270 precedes the 1.2300 and 1.2350 round figures to test the GBP/USD bulls before directing them to the yearly top, marked in February around 1.2450.
Overall, GBP/USD remains on the bull’s radar even if the pair snapped a four-day uptrend, as well as reversed from a one-month high, the previous day.
Trend: Upside expected
Technical Levels: Supports and Resistances
GBPUSD currently trading at 1.2156 at the time of writing. Pair opened at 1.2183 and is trading with a change of -0.22% % .
| Overview | Overview.1 | |
|---|---|---|
| 0 | Today last price | 1.2156 |
| 1 | Today Daily Change | -0.0027 |
| 2 | Today Daily Change % | -0.22% |
| 3 | Today daily open | 1.2183 |
The pair remains strongly bullish on the daily timeframe. It trades above its 20 SMA @ 1.2016, 50 SMA 1.2131, 100 SMA @ 1.2026 and 200 SMA @ 1.1899.
| Trends | Trends.1 | |
|---|---|---|
| 0 | Daily SMA20 | 1.2016 |
| 1 | Daily SMA50 | 1.2131 |
| 2 | Daily SMA100 | 1.2026 |
| 3 | Daily SMA200 | 1.1899 |
The previous day high was 1.22 while the previous day low was 1.2032. The daily 38.2% Fib levels comes at 1.2136, expected to provide support. Similarly, the daily 61.8% fib level is at 1.2096, expected to provide support.
Note the levels of interest below:
- Pivot support is noted at 1.2077, 1.197, 1.1909
- Pivot resistance is noted at 1.2244, 1.2306, 1.2412
| Levels | Levels.1 |
|---|---|
| Previous Daily High | 1.2200 |
| Previous Daily Low | 1.2032 |
| Previous Weekly High | 1.2114 |
| Previous Weekly Low | 1.1803 |
| Previous Monthly High | 1.2402 |
| Previous Monthly Low | 1.1915 |
| Daily Fibonacci 38.2% | 1.2136 |
| Daily Fibonacci 61.8% | 1.2096 |
| Daily Pivot Point S1 | 1.2077 |
| Daily Pivot Point S2 | 1.1970 |
| Daily Pivot Point S3 | 1.1909 |
| Daily Pivot Point R1 | 1.2244 |
| Daily Pivot Point R2 | 1.2306 |
| Daily Pivot Point R3 | 1.2412 |
[/s2If]
Join Our Telegram Group
")


