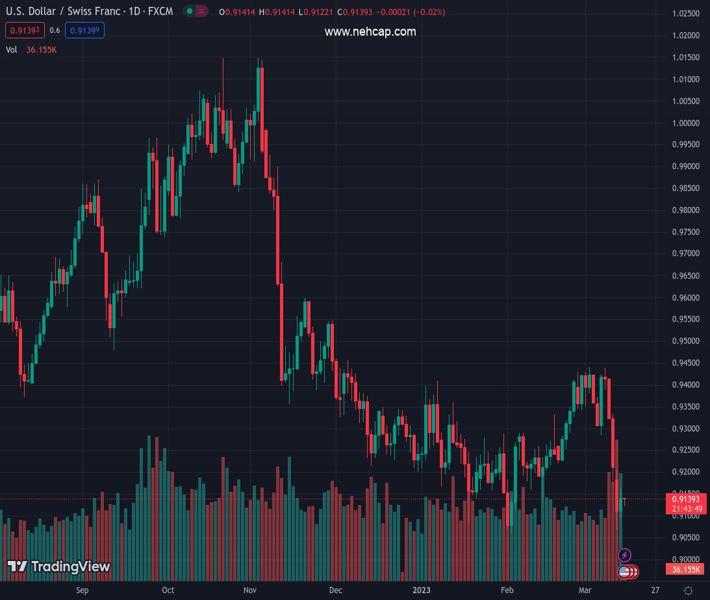
#USDCHF @ 0.91389 is facing barricades around 0.9150 as the appeal for safe-haven assets has been trimmed post-SVB collapse. (Pivot Orderbook analysis)
…
This is a premium post.
[s2If !current_user_can(access_s2member_level4)]Please register for PREMIUM VERSION HERE to read full post below containing analysis. In case of any error or you think you are not able to read the full post below, please email us at support#nehcap.com [lwa][/s2If] [s2If current_user_can(access_s2member_level4)]
- USD/CHF is facing barricades around 0.9150 as the appeal for safe-haven assets has been trimmed post-SVB collapse.
- One school of thought believes that core CPI is at uncomfortable levels despite US inflation softening.
- S&P500 was heavily bought as investors ignored the SVB collapse and cheered the declining trend in the US inflation.
The pair currently trades last at 0.91389.
The previous day high was 0.9214 while the previous day low was 0.9072. The daily 38.2% Fib levels comes at 0.9126, expected to provide support. Similarly, the daily 61.8% fib level is at 0.916, expected to provide resistance.
The USD/CHF pair is juggling in a narrow range below 0.9150 in the early Asian session. The upside in the Swiss Franc asset looks capped as the United States inflation worries have cooled down while the street was anticipating a red-hot inflation figure. The release of the headline and core Consumer Price Index (CPI) was in-line with the projections.
S&P500 futures have sensed a marginal decline after a solid bullish drive on Tuesday. Investors ignored the Silicon Valley Bank (SVB) collapse and cheered the declining trend in US inflation. On the US financial system, Federal Reserve (Fed) Governor Michelle Bowman cited “The US banking system has substantial liquidity and capital, and the Fed board is closely observing developments.
The US Dollar Index (DXY) showed a sideways auction on Tuesday despite the release of the US CPI data. The USD Index looks confined above 103.50 but is likely to show action ahead of the release of the US Retail Sales data.
The 10-year US Treasury yields have remained firmer and have scaled to near 3.69% amid mixed views from the street on US inflation data. Prices of used cars continued to decline, however, house rent is climbing higher, weighing immense pressure on households.
Analysts at Wells Fargo believe “Core CPI inflation remained entrenched at uncomfortably high levels. With core CPI up 0.5% in February, it is rising at an annualized rate of more than 5% whether measured on a 1-month, 3-month, or 12-month basis.” They further added, “With more than a week to go until the next Federal Reserve (Fed) meeting, a 25 bps rate hike is still a distinct possibility if financial stresses ease.”
On the Swiss Franc front, Producer and Import Prices (Feb) have declined dramatically, which shows weak consumer demand. Monthly data was contracted by 0.2% while the street was anticipating a contraction of 0.1%. The Annual figure dropped to 2.7% vs. the consensus of 3.4%. A decline in prices of goods and services at factory gates and lower prices for imports must have reduced stress for Swiss National Bank (SNB) policymakers, which were worried about rising price pressures.
Technical Levels: Supports and Resistances
USDCHF currently trading at 0.9139 at the time of writing. Pair opened at 0.9118 and is trading with a change of 0.23 % .
| Overview | Overview.1 | |
|---|---|---|
| 0 | Today last price | 0.9139 |
| 1 | Today Daily Change | 0.0021 |
| 2 | Today Daily Change % | 0.2300 |
| 3 | Today daily open | 0.9118 |
The pair remains strongly bearish on the daily time frame. It trades below the 20 SMA @ 0.9315, 50 SMA 0.9264, 100 SMA @ 0.9393 and 200 SMA @ 0.9558.
| Trends | Trends.1 | |
|---|---|---|
| 0 | Daily SMA20 | 0.9315 |
| 1 | Daily SMA50 | 0.9264 |
| 2 | Daily SMA100 | 0.9393 |
| 3 | Daily SMA200 | 0.9558 |
The previous day high was 0.9214 while the previous day low was 0.9072. The daily 38.2% Fib levels comes at 0.9126, expected to provide support. Similarly, the daily 61.8% fib level is at 0.916, expected to provide resistance.
Note the levels of interest below:
- Pivot support is noted at 0.9055, 0.8992, 0.8913
- Pivot resistance is noted at 0.9198, 0.9277, 0.934
| Levels | Levels.1 |
|---|---|
| Previous Daily High | 0.9214 |
| Previous Daily Low | 0.9072 |
| Previous Weekly High | 0.9439 |
| Previous Weekly Low | 0.9175 |
| Previous Monthly High | 0.9429 |
| Previous Monthly Low | 0.9059 |
| Daily Fibonacci 38.2% | 0.9126 |
| Daily Fibonacci 61.8% | 0.9160 |
| Daily Pivot Point S1 | 0.9055 |
| Daily Pivot Point S2 | 0.8992 |
| Daily Pivot Point S3 | 0.8913 |
| Daily Pivot Point R1 | 0.9198 |
| Daily Pivot Point R2 | 0.9277 |
| Daily Pivot Point R3 | 0.9340 |
[/s2If]
Join Our Telegram Group
")


