#NZDUSD @ 0.62341 struggles to extend three-day uptrend near the highest levels in a fortnight., @nehcap view: Further upside expected (Pivot Orderbook analysis)
…
This is a premium post.
[s2If !current_user_can(access_s2member_level4)]Please register for PREMIUM VERSION HERE to read full post below containing analysis. In case of any error or you think you are not able to read the full post below, please email us at support#nehcap.com [lwa][/s2If] [s2If current_user_can(access_s2member_level4)]
- NZD/USD struggles to extend three-day uptrend near the highest levels in a fortnight.
- 100, 200 EMAs restrict immediate upside even as trend line breakout, bullish MACD signals favor buyers.
- Four-month-old horizontal area is the key downside support.
The pair currently trades last at 0.62341.
The previous day high was 0.6265 while the previous day low was 0.6131. The daily 38.2% Fib levels comes at 0.6214, expected to provide support. Similarly, the daily 61.8% fib level is at 0.6182, expected to provide support.
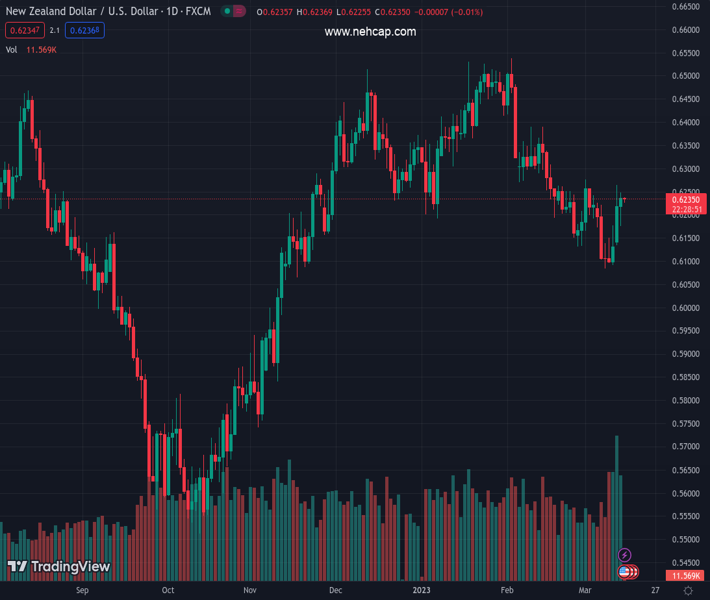
NZD/USD seesaws around 0.6235-30 during the early Wednesday morning in Asia-Pacific as bulls jostle with the key Exponential Moving Averages (EMA) to extend the three-day uptrend.
It should be noted, however, that the Kiwi pair’s latest run-up could be linked to a clear U-turn from the four-month-old horizontal support zone, around 0.6090-80, as well as clear upside break of the downward-sloping resistance line, now immediate support close to 0.6175.
Apart from the aforementioned catalysts, the bullish MACD signals also favor the NZD/USD upside.
However, the 100-day EMA precedes the 200-day EMA to restrict immediate upside of the Kiwi pair near 0.6240 and 0.6265 in that order.
Should the quote manages to remain firmer past 0.6265, the odds of witnessing a quickly run-up towards the 0.6300 threshold appears bright.
Following that, the mid-February swing high, close to 0.6390, holds the key to the NZD/USD bull’s further dominance towards poking February’s high near 0.6540.
Alternatively, a downside break of the resistance-turned-support near 0.6175 could lure the NZD/USD bears. Though, a sustained break of the horizontal area comprising multiple lows marked since November, near 0. 6090-80, will be necessary to push back the buyers.
Overall, NZD/USD is likely to rise further but the EMAs hold the gate for bulls.
Trend: Further upside expected
Technical Levels: Supports and Resistances
NZDUSD currently trading at 0.6237 at the time of writing. Pair opened at 0.622 and is trading with a change of 0.27% % .
| Overview | Overview.1 | |
|---|---|---|
| 0 | Today last price | 0.6237 |
| 1 | Today Daily Change | 0.0017 |
| 2 | Today Daily Change % | 0.27% |
| 3 | Today daily open | 0.622 |
The pair is trading above its 20 Daily moving average @ 0.6206, below its 50 Daily moving average @ 0.6317 , below its 100 Daily moving average @ 0.6245 and above its 200 Daily moving average @ 0.6167
| Trends | Trends.1 | |
|---|---|---|
| 0 | Daily SMA20 | 0.6206 |
| 1 | Daily SMA50 | 0.6317 |
| 2 | Daily SMA100 | 0.6245 |
| 3 | Daily SMA200 | 0.6167 |
The previous day high was 0.6265 while the previous day low was 0.6131. The daily 38.2% Fib levels comes at 0.6214, expected to provide support. Similarly, the daily 61.8% fib level is at 0.6182, expected to provide support.
Note the levels of interest below:
- Pivot support is noted at 0.6145, 0.6071, 0.6011
- Pivot resistance is noted at 0.628, 0.6339, 0.6414
| Levels | Levels.1 |
|---|---|
| Previous Daily High | 0.6265 |
| Previous Daily Low | 0.6131 |
| Previous Weekly High | 0.6226 |
| Previous Weekly Low | 0.6084 |
| Previous Monthly High | 0.6538 |
| Previous Monthly Low | 0.6131 |
| Daily Fibonacci 38.2% | 0.6214 |
| Daily Fibonacci 61.8% | 0.6182 |
| Daily Pivot Point S1 | 0.6145 |
| Daily Pivot Point S2 | 0.6071 |
| Daily Pivot Point S3 | 0.6011 |
| Daily Pivot Point R1 | 0.6280 |
| Daily Pivot Point R2 | 0.6339 |
| Daily Pivot Point R3 | 0.6414 |
[/s2If]
Join Our Telegram Group
")


